
Global IT Spending Market Research Report: Trends & Forecast (2026-2032)
By Components (Software, Devices, Data Centers, Communication Services, Services), By Type of Enterprises (Large Enterprises (Headcount Above 10,000), Mid-Size Enterprises (Headcou ... nt 5,000 to 10,000), Small Enterprises (Headcount Upto 5,000)), By End Users (Banking & Financial Services, Manufacturing, Retail & Ecommerce, IT, Telecom & Media, Healthcare, Government or Public Sector, Education, Others) Read more
- ICT & Electronics
- Feb 2026
- Pages 445
- Report Format: PDF, Excel, PPT
Global IT Spending Market
Projected 5.92% CAGR from 2026 to 2032
Study Period
2026-2032
Market Size (2026)
USD 2.11 Trillion
Market Size (2032)
USD 2.98 Trillion
Largest Region
North America
Projected CAGR
5.92%
Leading Segments
By Technology: Software
Global IT Spending Market Report Key Takeaways:
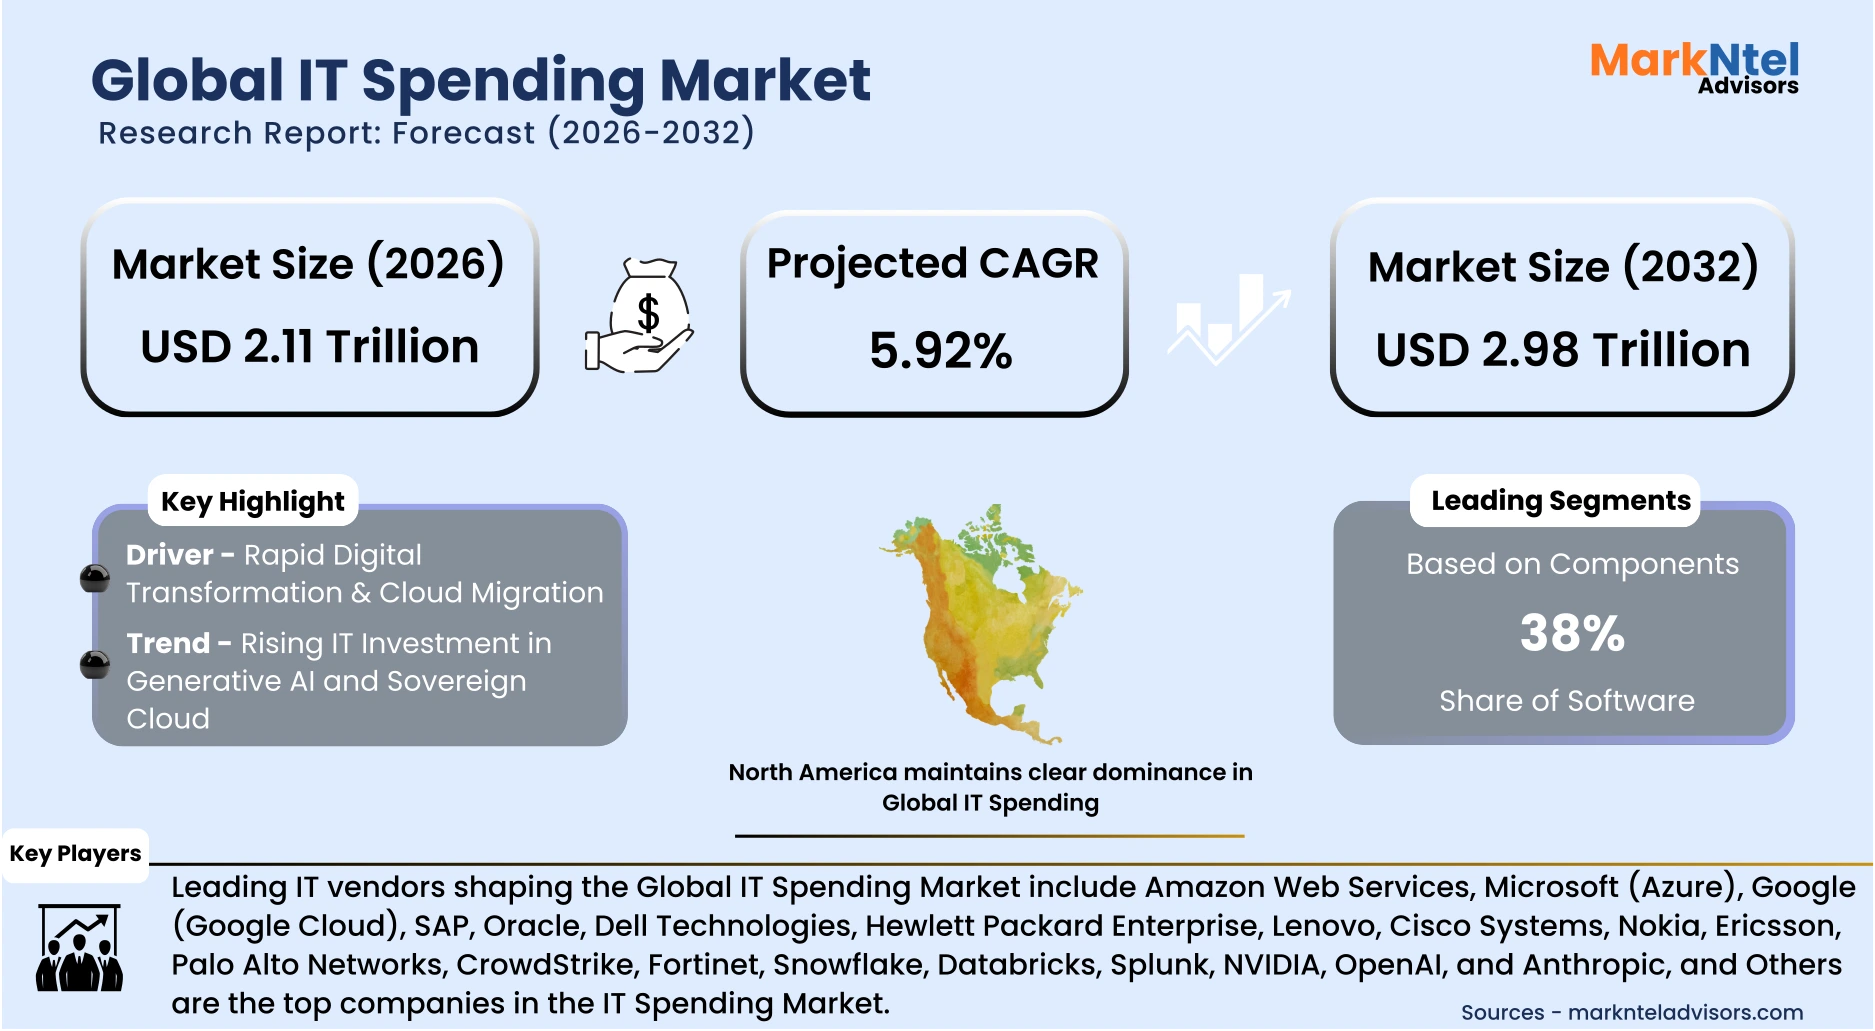
- The Global IT Spending stood at around USD 1.92 trillion in 2025 and is projected to grow from USD 2.11 trillion in 2026 to USD 2.98 trillion by 2032, exhibiting a CAGR of 5.92% during the forecast period.
- North America contributes about 42% of the total Global IT Spending in 2026. Meanwhile, China is also the fastest-growing country with a CAGR of about 11.19%, and its spending on Servers is expected to register a CAGR of 19.21% during 2026-32.
- By Components, around 38% of the total spending incurred on Software segment in 2026. Spending on the data center systems is projected to grow at a CAGR of about 15.18% during the forecast period, i.e., 2026-32.
- By End-User, around 22% of the total spending incurred on the Banking & Financial Services segment in 2026. Additionally, the Tier 2 Banks' Spending is estimated to grow at a CAGR of about 11.19% during 2026-32.
- Leading IT vendors shaping the Global IT Spending Market include Amazon Web Services, Microsoft (Azure), Google (Google Cloud), SAP, Oracle, Dell Technologies, Hewlett Packard Enterprise, Lenovo, Cisco Systems, Nokia, Ericsson, Palo Alto Networks, CrowdStrike, Fortinet, Snowflake, Databricks, Splunk, NVIDIA, OpenAI, and Anthropic, and Others.
Market Insights & Analysis: Global IT Spending Market (2026-32):
The Global IT Spending stood at around USD 1.92 trillion in 2025 and is projected to grow from USD 2.11 trillion in 2026 to USD 2.98 trillion by 2032. Along with this, the market is estimated to grow at a CAGR of around 5.92% during the forecast period, i.e., 2026-32.
Global IT spending continues to grow as organizations in healthcare, BFSI, manufacturing, retail, and other sectors fund key digital transformation initiatives. In 2026, global IT budgets are heavily focused on security and compliance, AI and automation, and cloud infrastructure, reflecting enterprise priorities for resilient systems and scalable operations. Cybersecurity spending is projected to grow significantly, with cybersecurity investments expected to reach about USD 260 billion globally by 2026, due to increasingly complex threat environments.
Additionally, healthcare organizations are directing large portions of their IT budgets toward EHR and clinical IT systems, with EHR implementation costs typically ranging from USD 2.6 million to over USD 5 million, and additional investments in telehealth platforms and AI analytics tools. Hospitals and provider networks are also increasing spending on cloud-based solutions and cybersecurity platforms to secure sensitive patient data while supporting digital care delivery. For instance, healthcare IT operating expenses at U.S. hospitals averaged about USD 10.5 million in 2024, reflecting significant overall IT investments.
Moreover, in BFSI, banks and financial institutions continue to spend on digital banking platforms, mobile apps, fraud detection systems, and data analytics tools to enhance customer experience, regulatory compliance, and operational efficiency. These investments encompass cloud services, AI-powered analytics, and advanced cybersecurity suites that address evolving risks.
Furthermore, retail and e-commerce companies are expanding IT spend on e-commerce platforms, omnichannel systems, data analytics, and personalization engines to support growing online sales and customer engagement. Retail IT budgets reflect increasing adoption of cloud-native commerce platforms and security systems.
Meanwhile, manufacturing firms are allocating budgets to ERP modernization, predictive maintenance software, digital twin platforms, and IoT solutions to improve operational efficiency and supply chain visibility. These initiatives typically involve integration of real-time analytics, AI-driven optimization, and cloud-based industrial platforms that support smart factory deployments.
Across these sectors, investment components such as software subscriptions (ERP, CRM, analytics), cloud infrastructure services, cybersecurity platforms, AI and automation tools, and hybrid work technologies continue to dominate IT spending, reinforcing the central role of digital technologies in driving enterprise competitiveness and operational resilience.
Global IT Spending Market Recent Developments:
- 2025: Amazon announced plans to invest up to USD50 billion in AI and high-performance computing infrastructure, expanding cloud and AI build-outs.
- 2026: Meta’s capital expenditure plans could expand further in 2026 to USD 115–135 billion, reinforcing that AI infrastructure build-out is a major long-term investment priority.
Global IT Spending Market Scope:
| Category | Segments |
|---|---|
| By Components | (Software, Devices, Data Centers, Communication Services, Services), |
| By Type of Enterprises | (Large Enterprises (Headcount Above 10,000), Mid-Size Enterprises (Headcount 5,000 to 10,000), Small Enterprises (Headcount Upto 5,000)), |
| By End Users | (Banking & Financial Services, Manufacturing, Retail & Ecommerce, IT, Telecom & Media, Healthcare, Government or Public Sector, Education, Others) |
Global IT Spending Market Driver:
Rapid Digital Transformation & Cloud Migration
Digital transformation and cloud migration are accelerating IT spending across industries as companies reallocate budgets to modernize systems, adopt cloud platforms, and support AI workloads. Financial firms are among the largest vendors. For instance, JPMorgan Chase plans to spend about USD19.8 billion on technology in 2026, significantly increasing investments in cloud-enabled systems and AI tools.
Similarly, Bank of America maintains a technology budget of nearly USD13 billion annually, with a substantial portion directed at digital platforms and cloud infrastructure modernization. In energy and infrastructure sectors, capital plans for data centers are surging, with companies like Dominion Energy raising five-year investment plans to USD64.7 billion, driven by AI and cloud-centric electricity demand growth. These factors are heavily contributing to the IT Spending globally.
Global IT Spending Market Trend:
Rising IT Investment in Generative AI and Sovereign Cloud
In the Global IT Spending landscape, enterprise budgets are increasingly redirected toward generative AI and sovereign cloud infrastructure, reinforcing a long-term shift from traditional hardware and legacy systems to secure, AI-ready cloud environments. Major cloud providers are committing billions of dollars to support this transformation. For example, Microsoft announced a USD 17.5 billion investment in India over four years (2026–2029) to expand cloud and AI infrastructure, build new hyperscale data centers, strengthen workforce skills, and support sovereign cloud capabilities for regulated enterprise workloads, its largest investment in Asia to date.
Additionally, in 2025, healthcare settings like Mayo Clinic have deployed an NVIDIA Blackwell DGX SuperPOD to run large medical AI models and are deepening AI collaborations with industry partners to scale diagnostics and research workflows, driving demand for compliant, high-performance compute.
Moreover, AI companies in India attracted 188 investment deals worth approximately USD 1.2 billion in 2025, marking a 58% year-on-year increase in funding value and reflecting strong investor confidence across enterprise AI adoption in software, healthcare, financial services, and industrial applications. For instance, HDFC Bank made a strategic investment in CoRover to build sovereign, multilingual AI capabilities for banking use cases, illustrating how banks fund local AI ecosystems while requiring in-country data controls.
Likewise, Sumo Logic has launched its security analytics platform on the AWS European Sovereign Cloud and Swiss regions so regulated customers in sectors like healthcare, finance, public sector can operate AI-driven monitoring and analytics without cross-border data transfers.
Global IT Spending Market Challenge:
Cybersecurity & Data Privacy Risks
In the Global IT Spending Market, cybersecurity and data privacy risks are emerging as a significant challenge alongside rapid digital transformation. As enterprises integrate distributed digital operations and migrate workloads to cloud platforms, deploy generative AI systems, their overall attack surface expands considerably. This higher level of connectivity increases exposure to ransomware, phishing, and large-scale data breaches.
For instance, in February 2024, UnitedHealth Group reported a major ransomware attack on its subsidiary Change Healthcare, disrupting pharmacy claims and healthcare payment systems across the United States. The company later estimated the financial impact at over USD 1.6 billion, highlighting the operational and financial risks facing highly digitized healthcare networks.
Additionally, in February 2026, the University of Mississippi Medical Center was hit by a ransomware attack that forced it to shut down dozens of clinics and cancel elective procedures. Electronic health record systems were disrupted, requiring manual operations and highlighting the vulnerability of digitally connected healthcare infrastructure.
Similarly, during 2025, U.S. banks and ATM operators faced a surge in “jackpotting” malware attacks, resulting in more than USD 20 million in losses, according to the Federal Bureau of Investigation. These attacks exploited system vulnerabilities to force ATMs to dispense cash illegally, demonstrating growing risks within the financial infrastructure.
Likewise, in February 2026, France’s national bank account registry (FICOBA) suffered a major data breach after hackers accessed stolen credentials, exposing the financial information of over 1.2 million individuals. This incident underscores the increasing threat of credential-based attacks targeting government-managed financial databases, thus slowing cloud and AI deployment timelines.
Global IT Spending Market (2026-32) Segmentation Analysis:
The Global IT Spending Market study of MarkNtel Advisors evaluates & highlights the major trends and influencing factors in each segment. It includes predictions for the period 2026–32 at the Global level. Based on the analysis, the market has been further classified as;
Based on Components:
- Software
- Enterprise Application Software
- Infrastructure Software
- Vertical Software
- Gen AI Models
- Others
- Devices
- Mobile Phones
- Tablets
- Desktops
- Laptops
- Data Centers
- Servers
- Enterprise Network Equipment
- External Controller-Based Software
- Others
- Communication Services
- Unified Communications
- Fixed Connectivity
- Mobile Connectivity
- Services
- Consulting
- Business Process Services
- Infrastructure Implementation & Managed Services
- Infrastructure as a Service (IaaS)
- Business Process Services
Software is the preferred component, with around 38% share in the total market spending, driven by enterprise demand for cloud platforms, cybersecurity tools, AI applications, and business automation systems. As organizations accelerate digital transformation, spending is increasingly directed toward scalable software solutions rather than standalone hardware investments.
For instance, in 2024–2025, Microsoft reported strong commercial adoption of Microsoft 365 Copilot, with large enterprises purchasing enterprise-wide licenses to integrate generative AI into workflow automation, analytics, and customer service operations. Similarly, Salesforce expanded its “Einstein” software across financial services and retail clients, prompting increased enterprise subscription spending.
Likewise, healthcare providers are accelerating investments in AI-enabled electronic health record (EHR) systems and cybersecurity platforms to improve efficiency while safeguarding sensitive patient data. For instance, Censinet secured approximately USD 9 million in funding to expand its RiskOps platform, strengthening third-party risk management across healthcare networks. Additionally, in the banking sector, the Institute for Development and Research in Banking Technology, in collaboration with Quick Heal Technologies, launched IB-CART 3.0, a sector-wide cyber threat intelligence and risk analytics platform to enhance coordinated defense among financial institutions. Similarly, manufacturing firms are modernizing ERP systems and adopting predictive maintenance and digital twin software, reinforcing software’s dominance in enterprise IT spending.
Based on End-User:
- Banking & Financial Services
- Manufacturing
- Retail & Ecommerce
- IT, Telecom & Media
- Healthcare
- Government or Public Sector
- Education
- Others
Banking and Financial Services (BFSI) segment is the primary contributor to the total Global IT Spending, with around 22% share because its core operations are entirely technology-driven and transaction-intensive. For instance, JPMorgan Chase made technological investments of roughly USD 17.5 billion in 2024, primarily supporting cloud infrastructure, AI-based fraud detection, and cyber resilience. Similarly, Bank of America reported annual technology spending of around USD 13 billion to enhance digital banking platforms and data analytics capabilities. Likewise, Citigroup has allocated over USD 11 billion in recent years toward core system modernization and regulatory compliance upgrades.
Moreover, high-frequency digital payments, real-time settlement systems, anti-money laundering monitoring, and evolving cybersecurity threats continuously expand infrastructure requirements. Additionally, regulatory mandates and digital currency experimentation further intensify system upgrades. As a result, BFSI consistently outpaces all other industries in IT budgets, maintaining its position as the world’s highest technology-spending sector.
Global IT Spending Market (2026-32): Regional Projection
North America maintains clear dominance in Global IT Spending with a substantial contribution of around 42% due to large-scale investments across cloud infrastructure, software, AI, semiconductors, and federal digital modernization. For instance, the U.S. Bureau of Economic Analysis (BEA) reported that U.S. private fixed investment in information processing equipment and software exceeded USD 1.13 trillion in 2023, demonstrating the scale of enterprise technology deployment. Additionally, the U.S. federal government allocated about USD 100 billion for IT spending in 2024, according to the U.S. Office of Management and Budget, covering cybersecurity, cloud migration, and digital public services.
Similarly, in semiconductor manufacturing, in August 2025, as part of efforts to reinforce U.S. semiconductor leadership, the United States government finalized an approximately USD 8.9 billion investment into Intel common stock, supported by previously awarded CHIPS and Science Act grants. This government stake adds to about USD 2.2 billion in earlier CHIPS-related funding, bringing the total infusion to roughly USD 11.1 billion aimed at expanding domestic semiconductor R&D and production capabilities.
Gain a Competitive Edge with Our Global IT Spending Market Report:
- Global IT Spending Market Report by MarkNtel Advisors provides a detailed & thorough analysis of market size & share, growth rate, competitive landscape, and key players. This comprehensive analysis helps businesses gain a holistic understanding of the market dynamics & make informed decisions.
- This report also highlights current market trends & future projections, allowing businesses to identify emerging opportunities & potential challenges. By understanding market forecasts, companies can align their strategies & stay ahead of the competition.
- Global IT Spending Market Report aids in assessing & mitigating risks associated with entering or operating in the market. By understanding market dynamics, regulatory frameworks, and potential challenges, businesses can develop strategies to minimize risks & optimize their operations.
*Reports Delivery Format - Market research studies from MarkNtel Advisors are offered in PDF, Excel and PowerPoint formats. Within 24 hours of the payment being successfully received, the report will be sent to your email address.
Frequently Asked Questions
- Spending Pattern
- Introduction
- Market Definition
- Research Process
- Assumptions
- Executive Summary
- Global IT Spending Statistical Trends & Insights
- Global IT Spending Market Dynamics
- Growth Drivers
- Challenges
- Global IT Spending Statistics & Future Outlook, 2022-2032
- Spending & Growth Outlook
- By Revenues (USD Million)
- IT Spending Segmentation & Growth Outlook
- By Components
- Software
- Enterprise Application Software
- Infrastructure Software
- Vertical Software
- Gen AI Models
- Others
- Devices
- Mobile Phones
- Tablets
- Desktops
- Laptops
- Data Centers
- Servers
- Enterprise Network Equipment
- External Controller-Based Software
- Others
- Communication Services
- Unified Communications
- Fixed Connectivity
- Mobile Connectivity
- Services
- Consulting
- Business Process Services
- Infrastructure Implementation & Managed Services
- Infrastructure as a Service (IaaS)
- Business Process Services
- Software
- By Type of Enterprises
- Large Enterprises (Headcount Above 10,000)
- Mid-Size Enterprises (Headcount 5,000 to 10,000)
- Small Enterprises (Headcount Upto 5,000)
- By End Users
- Banking & Financial Services
- Manufacturing
- Retail & Ecommerce
- IT, Telecom & Media
- Healthcare
- Government or Public Sector
- Education
- Others
- By Components
- Spending & Growth Outlook
- North America IT Spending Outlook, 2022-2032
- Spending & Growth Outlook
- By Revenues (USD Million)
- IT Spending Segmentation & Growth Outlook
- By Components
- By Type of Enterprises
- By End-User
- Top IT Spenders in the Category
- Name & Details of Top Enterprises
- Annual Budget & Approximate Future Spending on IT
- Key Decision Makers & Their Contact Details
- Key Vendors IT Vendors Catering to the Category
- Name of the IT Vendors
- Capabilities (Software or Service Offerings to the Enterprises in the Category)
- Future Plans
- By Country
- The US
- Canada
- Mexico
- Rest of North America
- The US IT Spending Outlook, 2022-2032
- IT Spending & Analysis
- By Revenues (USD Million)
- Spending Pattern & Analysis
- By Components
- By Type of Enterprises
- By End-User
- IT Spending & Analysis
- Canada IT Spending Outlook, 2022-2032
- IT Spending & Analysis
- By Revenues (USD Million)
- Spending Pattern & Analysis
- By Components
- By Type of Enterprises
- By End-User
- IT Spending & Analysis
- Mexico IT Spending Outlook, 2022-2032
- IT Spending & Analysis
- By Revenues (USD Million)
- Spending Pattern & Analysis
- By Components
- By Type of Enterprises
- By End-User
- IT Spending & Analysis
- Spending & Growth Outlook
- South America IT Spending Outlook, 2022-2032
- Spending & Growth Outlook
- By Revenues (USD Million)
- IT Spending Segmentation & Growth Outlook
- By Components
- By Type of Enterprises
- Top IT Spenders in the Category
- Name & Details of Top Enterprises
- Annual Budget & Approximate Future Spending on IT
- Key Decision Makers & Their Contact Details
- Key Vendors IT Vendors Catering to the Category
- Name of the IT Vendors
- Capabilities (Software or Service Offerings to the Enterprises in the Category)
- Future Plans
- By Country
- Brazil
- Argentina
- Chile
- Peru
- Rest of South America
- Brazil IT Spending Outlook, 2022-2032
- IT Spending & Analysis
- By Revenues (USD Million)
- Spending Pattern & Analysis
- By Components
- By Type of Enterprises
- By End-User
- IT Spending & Analysis
- Argentina IT Spending Outlook, 2022-2032
- IT Spending & Analysis
- By Revenues (USD Million)
- Spending Pattern & Analysis
- By Components
- By Type of Enterprises
- By End-User
- IT Spending & Analysis
- Chile IT Spending Outlook, 2022-2032
- IT Spending & Analysis
- By Revenues (USD Million)
- Spending Pattern & Analysis
- By Components
- By Type of Enterprises
- By End-User
- IT Spending & Analysis
- Peru IT Spending Outlook, 2022-2032
- IT Spending & Analysis
- By Revenues (USD Million)
- Spending Pattern & Analysis
- By Components
- By Type of Enterprises
- By End-User
- IT Spending & Analysis
- Spending & Growth Outlook
- Europe IT Spending Outlook, 2022-2032
- Spending & Growth Outlook
- By Revenues (USD Million)
- IT Spending Segmentation & Growth Outlook
- By Components
- By Type of Enterprises
- Top IT Spenders in the Category
- Name & Details of Top Enterprises
- Annual Budget & Approximate Future Spending on IT
- Key Decision Makers & Their Contact Details
- Key Vendors IT Vendors Catering to the Category
- Name of the IT Vendors
- Capabilities (Software or Service Offerings to the Enterprises in the Category)
- Future Plans
- By Country
- Germany
- United Kingdom
- France
- Italy
- Spain
- BENELUX
- Rest of Europe
- Germany IT Spending Outlook, 2022-2032
- IT Spending & Analysis
- By Revenues (USD Million)
- Spending Pattern & Analysis
- By Components
- By Type of Enterprises
- By End-User
- IT Spending & Analysis
- United Kingdom IT Spending Outlook, 2022-2032
- IT Spending & Analysis
- By Revenues (USD Million)
- Spending Pattern & Analysis
- By Components
- By Type of Enterprises
- By End-User
- IT Spending & Analysis
- France IT Spending Outlook, 2022-2032
- IT Spending & Analysis
- By Revenues (USD Million)
- Spending Pattern & Analysis
- By Components
- By Type of Enterprises
- By End-User
- IT Spending & Analysis
- Italy IT Spending Outlook, 2022-2032
- IT Spending & Analysis
- By Revenues (USD Million)
- Spending Pattern & Analysis
- By Components
- By Type of Enterprises
- By End-User
- IT Spending & Analysis
- Spain IT Spending Outlook, 2022-2032
- IT Spending & Analysis
- By Revenues (USD Million)
- Spending Pattern & Analysis
- By Components
- By Type of Enterprises
- By End-User
- IT Spending & Analysis
- BENELUX IT Spending Outlook, 2022-2032
- IT Spending & Analysis
- By Revenues (USD Million)
- Spending Pattern & Analysis
- By Components
- By Type of Enterprises
- By End-User
- IT Spending & Analysis
- Spending & Growth Outlook
- Middle East & Africa IT Spending Outlook, 2022-2032
- Spending & Growth Outlook
- By Revenues (USD Million)
- IT Spending Segmentation & Growth Outlook
- By Components
- By Type of Enterprises
- Top IT Spenders in the Category
- Name & Details of Top Enterprises
- Annual Budget & Approximate Future Spending on IT
- Key Decision Makers & Their Contact Details
- Key Vendors IT Vendors Catering to the Category
- Name of the IT Vendors
- Capabilities (Software or Service Offerings to the Enterprises in the Category)
- Future Plans
- By Country
- Saudi Arabia
- UAE
- Qatar
- Kuwait
- Oman
- Bahrain
- Egypt
- Morocco
- South Africa
- Rest of the Middle East & Africa
- Saudi Arabia IT Spending Outlook, 2022-2032
- IT Spending & Analysis
- By Revenues (USD Million)
- Spending Pattern & Analysis
- By Components
- By Type of Enterprises
- By End-User
- IT Spending & Analysis
- UAE IT Spending Outlook, 2022-2032
- IT Spending & Analysis
- By Revenues (USD Million)
- Spending Pattern & Analysis
- By Components
- By Type of Enterprises
- By End-User
- IT Spending & Analysis
- Qatar IT Spending Outlook, 2022-2032
- IT Spending & Analysis
- By Revenues (USD Million)
- Spending Pattern & Analysis
- By Components
- By Type of Enterprises
- By End-User
- IT Spending & Analysis
- Kuwait IT Spending Outlook, 2022-2032
- IT Spending & Analysis
- By Revenues (USD Million)
- Spending Pattern & Analysis
- By Components
- By Type of Enterprises
- By End-User
- IT Spending & Analysis
- Oman IT Spending Outlook, 2022-2032
- IT Spending & Analysis
- By Revenues (USD Million)
- Spending Pattern & Analysis
- By Components
- By Type of Enterprises
- By End-User
- IT Spending & Analysis
- Bahrain IT Spending Outlook, 2022-2032
- IT Spending & Analysis
- By Revenues (USD Million)
- Spending Pattern & Analysis
- By Components
- By Type of Enterprises
- By End-User
- IT Spending & Analysis
- Egypt IT Spending Outlook, 2022-2032
- IT Spending & Analysis
- By Revenues (USD Million)
- Spending Pattern & Analysis
- By Components
- By Type of Enterprises
- By End-User
- IT Spending & Analysis
- Morocco IT Spending Outlook, 2022-2032
- IT Spending & Analysis
- By Revenues (USD Million)
- Spending Pattern & Analysis
- By Components
- By Type of Enterprises
- By End-User
- IT Spending & Analysis
- South Africa IT Spending Outlook, 2022-2032
- IT Spending & Analysis
- By Revenues (USD Million)
- Spending Pattern & Analysis
- By Components
- By Type of Enterprises
- By End-User
- IT Spending & Analysis
- Spending & Growth Outlook
- Asia-Pacific IT Spending Outlook, 2022-2032
- Spending & Growth Outlook
- By Revenues (USD Million)
- IT Spending Segmentation & Growth Outlook
- By Components
- By Type of Enterprises
- Top IT Spenders in the Category
- Name & Details of Top Enterprises
- Annual Budget & Approximate Future Spending on IT
- Key Decision Makers & Their Contact Details
- Key Vendors IT Vendors Catering to the Category
- Name of the IT Vendors
- Capabilities (Software or Service Offerings to the Enterprises in the Category)
- Future Plans
- By Country
- China
- India
- Japan
- South Korea
- Indonesia
- Thailand
- Singapore
- Malaysia
- Philippines
- Vietnam
- Australia
- Rest of Asia-Pacific
- China IT Spending Outlook, 2022-2032
- IT Spending & Analysis
- By Revenues (USD Million)
- Spending Pattern & Analysis
- By Components
- By Type of Enterprises
- By End-User
- IT Spending & Analysis
- India IT Spending Outlook, 2022-2032
- IT Spending & Analysis
- By Revenues (USD Million)
- Spending Pattern & Analysis
- By Components
- By Type of Enterprises
- By End-User
- IT Spending & Analysis
- Japan IT Spending Outlook, 2022-2032
- IT Spending & Analysis
- By Revenues (USD Million)
- Spending Pattern & Analysis
- By Components
- By Type of Enterprises
- By End-User
- IT Spending & Analysis
- South Korea IT Spending Outlook, 2022-2032
- IT Spending & Analysis
- By Revenues (USD Million)
- Spending Pattern & Analysis
- By Components
- By Type of Enterprises
- By End-User
- IT Spending & Analysis
- Indonesia IT Spending Outlook, 2022-2032
- IT Spending & Analysis
- By Revenues (USD Million)
- Spending Pattern & Analysis
- By Components
- By Type of Enterprises
- By End-User
- IT Spending & Analysis
- Thailand IT Spending Outlook, 2022-2032
- IT Spending & Analysis
- By Revenues (USD Million)
- Spending Pattern & Analysis
- By Components
- By Type of Enterprises
- By End-User
- IT Spending & Analysis
- Singapore IT Spending Outlook, 2022-2032
- IT Spending & Analysis
- By Revenues (USD Million)
- Spending Pattern & Analysis
- By Components
- By Type of Enterprises
- By End-User
- IT Spending & Analysis
- Malaysia IT Spending Outlook, 2022-2032
- IT Spending & Analysis
- By Revenues (USD Million)
- Spending Pattern & Analysis
- By Components
- By Type of Enterprises
- By End-User
- IT Spending & Analysis
- Philippines IT Spending Outlook, 2022-2032
- IT Spending & Analysis
- By Revenues (USD Million)
- Spending Pattern & Analysis
- By Components
- By Type of Enterprises
- By End-User
- IT Spending & Analysis
- Vietnam IT Spending Outlook, 2022-2032
- IT Spending & Analysis
- By Revenues (USD Million)
- Spending Pattern & Analysis
- By Components
- By Type of Enterprises
- By End-User
- IT Spending & Analysis
- Australia IT Spending Outlook, 2022-2032
- IT Spending & Analysis
- By Revenues (USD Million)
- Spending Pattern & Analysis
- By Components
- By Type of Enterprises
- By End-User
- IT Spending & Analysis
- Spending & Growth Outlook
- Competition Outlook
- Vendor Profiles
- Amazon Web Services (AWS)
- Business Description
- Type Portfolio
- Strategic Alliances or Partnerships
- Recent Developments
- Financial Details
- Others
- Microsoft Azure
- Business Description
- Type Portfolio
- Strategic Alliances or Partnerships
- Recent Developments
- Financial Details
- Others
- Google Cloud
- Business Description
- Type Portfolio
- Strategic Alliances or Partnerships
- Recent Developments
- Financial Details
- Others
- SAP
- Business Description
- Type Portfolio
- Strategic Alliances or Partnerships
- Recent Developments
- Financial Details
- Others
- Oracle
- Business Description
- Type Portfolio
- Strategic Alliances or Partnerships
- Recent Developments
- Financial Details
- Others
- Dell Technologies
- Business Description
- Type Portfolio
- Strategic Alliances or Partnerships
- Recent Developments
- Financial Details
- Others
- Hewlett Packard Enterprise (HPE)
- Business Description
- Type Portfolio
- Strategic Alliances or Partnerships
- Recent Developments
- Financial Details
- Others
- Lenovo
- Business Description
- Type Portfolio
- Strategic Alliances or Partnerships
- Recent Developments
- Financial Details
- Others
- Cisco Systems
- Business Description
- Type Portfolio
- Strategic Alliances or Partnerships
- Recent Developments
- Financial Details
- Others
- Nokia
- Business Description
- Type Portfolio
- Strategic Alliances or Partnerships
- Recent Developments
- Financial Details
- Others
- Ericsson
- Business Description
- Type Portfolio
- Strategic Alliances or Partnerships
- Recent Developments
- Financial Details
- Others
- Palo Alto Networks
- Business Description
- Type Portfolio
- Strategic Alliances or Partnerships
- Recent Developments
- Financial Details
- Others
- CrowdStrike
- Business Description
- Type Portfolio
- Strategic Alliances or Partnerships
- Recent Developments
- Financial Details
- Others
- Fortinet
- Business Description
- Type Portfolio
- Strategic Alliances or Partnerships
- Recent Developments
- Financial Details
- Others
- Snowflake
- Business Description
- Type Portfolio
- Strategic Alliances or Partnerships
- Recent Developments
- Financial Details
- Others
- Databricks
- Business Description
- Type Portfolio
- Strategic Alliances or Partnerships
- Recent Developments
- Financial Details
- Others
- Splunk
- Business Description
- Type Portfolio
- Strategic Alliances or Partnerships
- Recent Developments
- Financial Details
- Others
- NVIDIA
- Business Description
- Type Portfolio
- Strategic Alliances or Partnerships
- Recent Developments
- Financial Details
- Others
- OpenAI
- Business Description
- Type Portfolio
- Strategic Alliances or Partnerships
- Recent Developments
- Financial Details
- Others
- Anthropic
- Business Description
- Type Portfolio
- Strategic Alliances or Partnerships
- Recent Developments
- Financial Details
- Others
- Others
- Amazon Web Services (AWS)
- Vendor Profiles
- Disclaimer
MarkNtel Advisors follows a robust and iterative research methodology designed to ensure maximum accuracy and minimize deviation in market estimates and forecasts. Our approach combines both bottom-up and top-down techniques to effectively segment and quantify various aspects of the market. A consistent feature across all our research reports is data triangulation, which examines the market from three distinct perspectives to validate findings. Key components of our research process include:
1. Scope & Research Design At the outset, MarkNtel Advisors define the research objectives and formulate pertinent questions. This phase involves determining the type of research—qualitative or quantitative—and designing a methodology that outlines data collection methods, target demographics, and analytical tools. They also establish timelines and budgets to ensure the research aligns with client goals.
2. Sample Selection and Data Collection In this stage, the firm identifies the target audience and determines the appropriate sample size to ensure representativeness. They employ various sampling methods, such as random or stratified sampling, based on the research objectives. Data collection is carried out using tools like surveys, interviews, and observations, ensuring the gathered data is reliable and relevant.
3. Data Analysis and Validation Once data is collected, MarkNtel Advisors undertake a rigorous analysis process. This includes cleaning the data to remove inconsistencies, employing statistical software for quantitative analysis, and thematic analysis for qualitative data. Validation steps are taken to ensure the accuracy and reliability of the findings, minimizing biases and errors.

4. Data Forecast and FinalizationThe final phase involves forecasting future market trends based on the analyzed data. MarkNtel Advisors utilize predictive modeling and time series analysis to anticipate market behaviors. The insights are then compiled into comprehensive reports, featuring visual aids like charts and graphs, and include strategic recommendations to inform client decision-making
We offer flexible licensing options to cater to varying organizational needs. Choose the pricing pack that best suits your requirements:
Buy Now

