Asia-Pacific Smart Vending Machine Market Research Report: Forecast (2026-2032)
By Payment Mode (Cashless Payment Machines, Hybrid Payment Machines (Cash + Digital), Closed-Loop / App-Based Payment Systems), and others ... Read more
- FMCG
- May 2026
- Pages 162
- Report Format: PDF, Excel, PPT
Asia-Pacific Smart Vending Machine Market
Projected 12.25% CAGR from 2026 to 2032
Study Period
2026-2032
Market Size (2026)
USD 8.1 Billion
Market Size (2032)
USD 16.2 Billion
Base Year
2025
Projected CAGR
12.25%
Leading Segments
By Product Type: Food & Beverage
Asia-Pacific Smart Vending Machine Market Key Takeaways
- The Asia-Pacific Smart Vending Machine Market was valued at USD 6.5 billion in 2025 and is projected to grow from USD 8.1 billion in 2026 to USD 16.2 billion by 2032, registering a CAGR of 12.25% during 2026–2032.
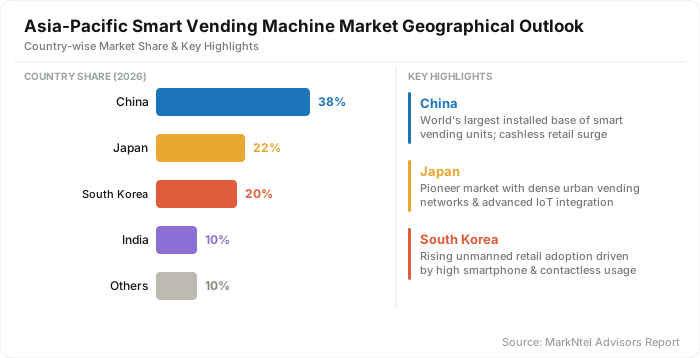
- China accounts for the largest market share, contributing approximately 38% of the regional revenue.
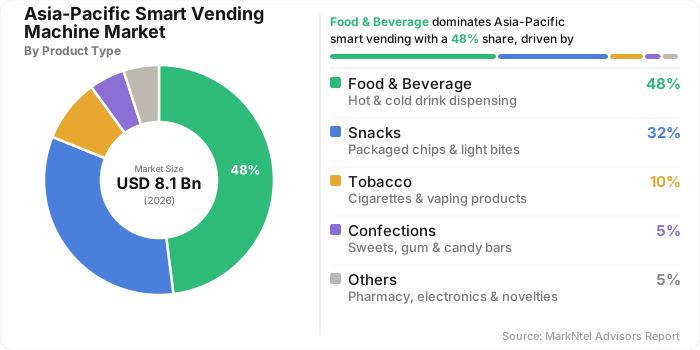
- By product type, the Food & Beverage segment holds a dominant position, accounting for nearly 48% of the total market share.
- Based on application, commercial malls and retail stores captured a significant share of around 45% in 2026.
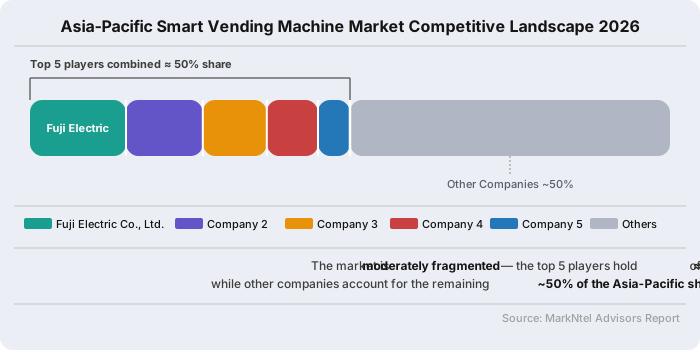
- The market is moderately consolidated, with the top five players collectively accounting for nearly 50% of the total market share.
Asia-Pacific Smart Vending Machine Market Size and Outlook
The Asia-Pacific Smart Vending Machine Market is projected to grow at a CAGR of approximately 12.25% during the forecast period (2026–2032). This growth is driven by the increasing adoption of digital payment systems, rising demand for automation, and the expanding presence of unmanned retail infrastructure across the region.
One of the strongest underlying drivers is the increasing adoption of cashless transactions across the region, which is enabling seamless integration of vending machines into everyday retail ecosystems. In the Philippines, for instance, the Bangko Sentral ng Pilipinas reported that digital payments accounted for 57.4% of total retail transaction volume and 59% by value in 2024, with monthly digital payment value reaching approximately USD 136 billion. This reflects a strong structural shift toward digital-first consumer behavior, creating favorable conditions for automated vending adoption.
Alongside this financial transformation, the market is increasingly influenced by the integration of AI and IoT technologies in smart vending systems. These technologies are enabling vending machines to evolve into intelligent retail nodes capable of real-time data analysis, demand forecasting, and personalized product recommendations. IoT connectivity allows continuous monitoring of inventory levels and machine performance, while predictive algorithms help optimize restocking cycles and reduce operational downtime. This shift is improving efficiency across vending networks and supporting the development of highly automated, data-driven retail ecosystems across urban Asia-Pacific environments.
In parallel, retail operators are also exploring fully automated store formats as part of broader unmanned retail strategies. For example, the introduction of a fully automated, staff-free convenience store by 7-Eleven in Melbourne’s CBD, which operates entirely through vending-based systems and card payments. The store was developed in response to rising retail crime and safety concerns, and it reflects a broader shift toward surveillance-supported, automation-driven retail models in developed urban markets.
Collectively, these developments indicate a positive market outlook, with the industry projected to grow from USD 8.1 billion in 2026 to USD 16.2 billion by 2032, as digital payment penetration, AI-driven automation, and the adoption of unmanned retail continue to reshape the smart vending machine landscape. Asia-Pacific, characterized by high urban density, expanding digital infrastructure, and a growing preference for contactless convenience, is expected to remain a key growth hub for smart vending deployment across commercial, institutional, and public environments.
Asia-Pacific Smart Vending Machine Market Key Indicators
- Japan has around 3.9 million vending machines nationwide, making it the world’s most dense automated retail market. Beverage vending dominates the majority share, with machines widely integrated into metro stations, streets, and commercial areas. These systems reflect high energy use, advanced automation, and strong cultural dependence on convenience retail infrastructure across urban Japan.
- In India, CBRE reports that around 85% of companies are planning to expand office portfolios over the next two years, reflecting strong growth in organized corporate infrastructure. This expansion is directly increasing the installation of smart vending machines in IT parks, co-working spaces, and corporate campuses, where demand for automated retail convenience is rising.
- Metro stations in Asia Pacific serve as a high-impact indicator of smart vending machine adoption due to dense commuter traffic and rapid cashless penetration. Japan demonstrates advanced integration through AI-enabled vending across JR East and Tokyo Metro networks, while India is scaling deployments across metro corridors to support non-fare revenue. These environments highlight strong transaction frequency, operational efficiency, and real-time automated retail penetration.
- Smart vending machines in schools and universities represent a key indicator of institutional adoption of automated retail systems in the Asia Pacific. They provide 24/7 access to food, beverages, and essentials while improving operational efficiency and revenue generation. Example like Neuroshop highlights deployments in educational campuses eflecting growing integration of cashless payments, IoT monitoring, and student-focused convenience retail solutions.
Asia-Pacific Smart Vending Machine Market Scope
| Category | Segments |
|---|---|
| By Payment Mode | Cashless Payment Machines, Hybrid Payment Machines (Cash + Digital), Closed-Loop / App-Based Payment Systems |
| By Region | China, Japan, India, South Korea, Singapore, Indonesia, Thailand, Malaysia, Vietnam, Australia, Philippines, Rest of Asia Pacific |
Asia-Pacific Smart Vending Machine Market Growth Drivers
Surge in Digital Payments with High-Frequency Urban Consumption
The expansion of real-time digital payment systems across Asia-Pacific is playing a decisive role in transforming everyday consumption patterns, thereby strengthening the foundation for smart vending machine adoption. In India, the Reserve Bank of India reports that digital payments accounted for 99.7% of total transaction volume in 2024, highlighting a near-complete shift away from cash-based transactions. Within this ecosystem, UPI processed 17,221 crore transactions with a total value of approximately USD 2.85 trillion, underlining its widespread use for low-value, high-frequency purchases such as snacks, beverages, and essential goods.
A comparable trajectory is observed in Thailand, where the PromptPay system has evolved into a core component of the national payment infrastructure. Recognized as a systemically important retail payment system by the Bank of Thailand, PromptPay processes over 74 million transactions daily and serves more than 90 million registered users as of 2026. Its extensive usage across both retail payments and government transfers reflects deep integration into routine economic activity, particularly for micro-transactions.
The alignment between widespread digital payment adoption and high-frequency consumption behavior directly enhances the operational efficiency of smart vending machines, where seamless and instant transactions are critical.
Overall, as digital payment ecosystems continue to mature, they are enabling frictionless, high-volume micro-transactions, thereby accelerating the scalability and commercial viability of smart vending solutions across urban markets.
Recent Trends
AI & IoT-Integrated Smart Vending with Real-Time Inventory Monitoring
The smart vending machine market is undergoing a structural transformation driven by the integration of AI and IoT technologies, repositioning vending systems from basic dispensing units to connected, data-driven micro-retail ecosystems. This evolution is being shaped by rising urban consumption density, increasing demand for contactless retail, and the need for efficient, real-time inventory management across distributed retail locations.
Recent deployments indicate that modern smart vending systems in India are now equipped with IoT-enabled sensors and cloud-connected platforms that continuously capture and transmit data on inventory levels, machine health, and sales performance in real time. According to industry implementation insights highlighted by SnaxSmart, these systems allow operators to remotely monitor stock availability, generate automated replenishment alerts, and optimize product assortment based on location-specific demand patterns across offices, hospitals, IT parks, and transit hubs.
The integration of AI-based analytics with UPI-enabled cashless payment systems and centralized control dashboards is further strengthening operational efficiency. It is enabling vending operators to move from traditional reactive restocking models to predictive and demand-driven supply chain frameworks, improving product availability while minimizing wastage and stock imbalances.
In addition, IoT-enabled connectivity supports remote diagnostics and real-time machine monitoring, reducing downtime and enabling faster maintenance response cycles. This is particularly relevant in India’s rapidly expanding urban infrastructure, where speed, hygiene, and uninterrupted product access are key consumption requirements.
The convergence of AI and IoT technologies is fundamentally reshaping India’s smart vending landscape into an intelligent, automated retail network. This transformation is enhancing operational scalability, improving supply chain precision, and driving the widespread adoption of unattended retail solutions across high-density urban environments.
Asia-Pacific Smart Vending Machine Market Opportunities and Challenges
High FMCG Distribution Constraints Driving the Shift Toward Smart Vending-Based Micro-Retail Expansion
A key challenge in the Asia-Pacific smart vending machine market lies in the reliance on traditional FMCG distribution networks, which often struggle to ensure efficient last-mile availability in high-density urban environments. Conventional retail formats face limitations such as restricted operating hours, space constraints, and higher operational costs, leading to inefficiencies in product accessibility across locations like offices, hospitals, and transit hubs. In emerging economies, fragmented retail infrastructure further restricts seamless product penetration and real-time inventory responsiveness for fast-moving consumer goods.
This structural challenge is increasingly creating opportunities for the expansion of smart vending-based micro-retail ecosystems. A notable example is BuyBuyCart’s deployment of smart vending machines offering 24/7 access to FMCG essentials such as snacks, beverages, and personal care products in corporate campuses and high-footfall public spaces. These systems integrate cashless payment options such as UPI and digital wallets, enabling frictionless transactions while reducing dependency on traditional retail intermediaries. Additionally, FOCO and COCO operational models are enabling scalable deployment across multiple urban and semi-urban locations with minimal infrastructure requirements.
As a result, smart vending machines are evolving into distributed retail nodes that enhance product availability, improve supply chain efficiency, and enable direct-to-consumer engagement. This transition also allows FMCG brands to leverage real-time consumption data for better demand forecasting and inventory optimization.
The shift from traditional FMCG distribution systems toward smart vending-enabled micro-retail networks is transforming retail accessibility. This evolution is creating scalable growth opportunities by improving efficiency, reducing operational friction, and enabling continuous, data-driven product delivery across urban Asia-Pacific markets.
Segmentation Insights
Food & Beverage Segment Dominates the Smart Vending Machine Industry
The Food & Beverage segment holds the dominant 48% share of the Asia-Pacific smart vending machine market due to its high-frequency consumption patterns and strong alignment with urban on-the-go lifestyles. This category benefits from consistent daily demand for beverages, ready-to-eat meals, and packaged refreshments across workplaces, transit hubs, and institutional spaces. The rising preference for contactless and instant purchase options has significantly strengthened vending adoption in this segment, particularly in densely populated urban areas.
Another key growth factor is the integration of cashless payment systems and IoT-enabled inventory monitoring, which ensures continuous product availability and reduces operational inefficiencies such as stockouts and wastage. Additionally, food and beverage vending machines are increasingly being deployed in offices, hospitals, and transport stations, where convenience and speed are critical drivers of consumption.
The expansion of urban working populations and 24/7 consumption behavior is further accelerating demand. Operators are also enhancing product variety, including healthier beverage options and premium snack offerings, which is improving consumer acceptance. As a result, the Food & Beverage segment remains the most commercially viable category, supported by scalability, recurring demand cycles, and strong compatibility with automated retail infrastructure. Based on product type, the scope has been segmented into
- Food & Beverage
- Snacks
- Tobacco
- Confections
- Others
Commercial Malls & Retail Stores leads the application segment
The Commercial Malls & Retail Stores segment accounts for approximately 45% share, making it the largest revenue contributor among end-use industries. This is primarily driven high footfall density and strong retail ecosystem integration. These environments provide an ideal setting for vending machines as they enable impulse purchasing behavior, particularly in shopping complexes, supermarkets, and entertainment zones.
A major growth driver is the increasing deployment of compact and freestanding vending machines that operate as supplementary retail points within malls and stores. These machines enhance customer convenience by offering quick access to beverages, snacks, and essential products without requiring checkout queues. This improves customer flow efficiency and increases overall retail engagement.
The rise of cashless transactions and digital payment platforms has further strengthened vending adoption in these spaces, enabling seamless, frictionless purchasing experiences. Retail operators are also leveraging vending machines to optimize floor space utilization while expanding product accessibility.
Additionally, commercial retail environments are increasingly adopting vending machines as part of omnichannel retail strategies, blending physical and automated retail experiences. This allows retailers to extend service hours beyond traditional store timings, enhancing revenue generation and customer convenience. As a result, Commercial Malls & Retail Stores remain a key high-value application segment driven by traffic density, convenience demand, and retail innovation. The key application mapped in the study involve:
- Quick Service Restaurant
- Commercial Malls & Retail Stores
- Offices
- Public Transport
- Shopping Centers
- Others
Asia-Pacific Smart Vending Machine Industry Geographical Outlook
The Japan region accounts for approximately 38% of Asia-Pacific Smart Vending Machine demand, driven by high urban density, strong automation adoption, and deep integration of cashless payment infrastructure. Japan represents a key innovation hub for smart vending deployment, particularly in beverage, food, and unattended retail systems across transit hubs, commercial zones, and institutional spaces.
A major structural driver of market expansion is Japan’s rapid transition toward a cashless economy. According to the Ministry of Economy, Trade and Industry (METI), the country’s cashless payment ratio reached 42.8% in 2024 (approximately USD 950 billion equivalent), surpassing the national target, with a long-term government ambition to reach 80% cashless penetration. This strong policy direction is accelerating the integration of vending machines with contactless payment systems, QR-based transactions, and digital wallets, making them more efficient and widely accessible.
In addition, Japan’s vending ecosystem is highly advanced in terms of automation and scale. The country hosts one of the highest vending machine densities globally, supported by continuous innovation in IoT-enabled machines, AI-based inventory tracking, and remote monitoring systems across urban locations. These systems are widely deployed in railway stations, office districts, and convenience-heavy commercial zones, enabling 24/7 unattended retail operations.
A real-world example includes the large-scale deployment of smart beverage vending networks integrated with digital payment systems in urban transport and commercial hubs, where machines operate as part of Japan’s broader smart retail infrastructure ecosystem. This reflects the country’s leadership in combining automation, cashless payments, and smart city infrastructure development.
Japan dominates the Asia-Pacific smart vending machine landscape due to its high cashless payment penetration, advanced automation ecosystem, and strong government-backed digital transformation policies, making it a key innovation and adoption hub for next-generation smart vending technologies.
Asia-Pacific Smart Vending Machine Industry Competitive Analysis
The Asia-Pacific smart vending machine market is moderately consolidated, with a mix of established Japanese manufacturers and global vending technology providers operating across food & beverage, payment systems, and IoT-enabled automated retail solutions. The top five companies, including Fuji Electric Co., Ltd., Glory Ltd., Sanden Holdings Corporation, Azkoyen Group, and Crane Co., collectively account for approximately 50% of the regional market share, reflecting strong dominance driven by Japan-led vending infrastructure and advanced cashless and IoT integration capabilities.
Major Smart Vending Machine Companies in Asia-Pacific
- Fuji Electric Co., Ltd.
- Silkron Technology Sdn Bhd
- Daalchini
- Glory Ltd.
- Azkoyen Group
- Sanden Holdings Corporation
- Crane Co.
- Aramark Corporation
- Asahi Group Holdings, Ltd.
- Others
Asia-Pacific Smart Vending Machine Industry News and Recent Developments
August 2025: Vendekin Expands vNetra Cloud Platform to Strengthen AI-Driven Smart Vending Ecosystem in Asia-Pacific
Vendekin enhanced its vNetra cloud platform to support cashless payments, real-time analytics, and AI-based inventory optimization for smart vending machines. The upgrade enables operators to remotely monitor machine performance, predict demand patterns, and automate restocking processes. This strengthens the role of vending machines as scalable, connected retail infrastructure across Asia-Pacific markets.
Impact Analysis: The advancement of Vendekin’s cloud platform significantly improves operational efficiency and scalability in smart vending ecosystems. AI-driven analytics reduce stockouts and optimize product placement, while cashless integration enhances transaction speed and user convenience. For operators, it lowers maintenance costs and enables data-led decision-making. In the Asia-Pacific region, this strengthens the shift toward fully automated, IoT-enabled retail networks, accelerating adoption in offices, transport hubs, and institutional environments.
March 2025: Coca-Cola Bottlers Japan Deploys Hydrogen-Powered Smart Vending Machines at Expo 2025 Osaka
Coca-Cola Bottlers Japan, in collaboration with Fuji Electric, introduced hydrogen cartridge-powered vending machines at Expo 2025 Osaka. The machines generate electricity through a hydrogen–oxygen reaction, enabling off-grid operation without external power supply. A total of 58 units were installed, integrated with digital displays and the Coke ON app to enhance accessibility and user interaction.
Impact Analysis: This innovation strengthens the shift toward sustainable and energy-independent vending infrastructure in Japan’s smart retail ecosystem. By eliminating dependency on power outlets, it increases deployment flexibility across public spaces such as expos, transport hubs, and urban zones. The integration of app-based connectivity enhances user engagement and accessibility, while supporting Japan’s broader carbon neutrality goals. It also sets a benchmark for next-generation smart vending systems combining clean energy, automation, and digital retail experience.
Frequently Asked Questions
- Market Segmentation
- Introduction
- Product Definition
- Research Process
- Assumptions
- Executive Summary
- Asia-Pacific Smart Vending Machine Market Policies, Regulations, and Product Standards
- Asia-Pacific Smart Vending Machine Market Trends & Developments
- Asia Pacific Smart Vending Machine (Thousand Units) Trend By Type of Product
- Food & Beverage
- Snacks
- Tobacco
- Confections
- Others
- Company Wise Production Plants and Statistics
- Installed Production Capacity
- Actual Production
- Planned Production Target
- Asia Pacific Smart Vending Machine (Thousand Units) Trend By Type of Product
- Asia Pacific Smart Vending Machine Pricing Analysis 2022-2032
- Asia Pacific Smart Vending Machine Trend (USD/Units) 2022-2032
- Asia Pacific Smart Vending Machine Trend (USD/Units) By Regions 2022-2032
- China
- Japan
- India
- South Korea
- Singapore
- Indonesia
- Thailand
- Malaysia
- Vietnam
- Australia
- Philippines
- Rest of Asia Pacific
- Asia Pacific Smart Vending Machine Trend (USD/Units) By Product Type 2022-2032
- Food & Beverage
- Snacks
- Tobacco
- Confections
- Others
- Asia-Pacific Smart Vending Machine Market Dynamics
- Growth Drivers
- Challenges
- Asia-Pacific Smart Vending Machine Market Hotspot & Opportunities
- Asia-Pacific Smart Vending Machine Market Outlook, 2022-2032
- Market Size & Outlook
- By Revenues (USD Million)
- Unit Sold (Thousand Units)
- Market Share & Outlook
- By Product Type – Market Size & Forecast 2022-2032, USD Million & Thousand Units
- Food & Beverage
- Snacks
- Tobacco
- Confections
- Others
- By Product Type – Market Size & Forecast 2022-2032, USD Million & Thousand Units
- By Machine Configuration – Market Size & Forecast 2022–2032, USD Million & Thousand Units
- Freestanding Vending Machines
- Wall-Mounted Vending Machines
- Tabletop / Compact Vending Machines
- Market Size & Outlook
- By Application– Market Size & Forecast 2022-2032, USD Million & Thousand Units
- Quick Service Restaurant
- Commercial Malls & Retail Stores
- Offices
- Public Transport
- Shopping Centers
- Others
- By Payment Mode– Market Size & Forecast 2022-2032, USD Million & Thousand Units
- Cashless Payment Machines
- Hybrid Payment Machines (Cash + Digital)
- Closed-Loop / App-Based Payment Systems
- By Region
- China
- Japan
- India
- South Korea
- Singapore
- Indonesia
- Thailand
- Malaysia
- Vietnam
- Australia
- Philippines
- Rest of Asia Pacific
- By Company
- Company Revenue Shares
- Competitor Characteristics
- China Smart Vending Machine Market Outlook, 2022-2032
- Market Size & Outlook
- By Revenues (USD Million)
- Unit Sold (Thousand Units)
- Market Share & Outlook
- By Product Type – Market Size & Forecast 2022-2032, USD Million
- By Machine Configuration– Market Size & Forecast 2022-2032, USD Million
- By Application– Market Size & Forecast 2022-2032, USD Million
- By Payment Mode – Market Size & Forecast 2022-2032, USD Million
- By Region
- Market Size & Outlook
- Japan Smart Vending Machine Market Outlook, 2022-2032
- Market Size & Outlook
- By Revenues (USD Million)
- Unit Sold (Thousand Units)
- Market Share & Outlook
- By Product Type – Market Size & Forecast 2022-2032, USD Million
- By Machine Configuration– Market Size & Forecast 2022-2032, USD Million
- By Application– Market Size & Forecast 2022-2032, USD Million
- By Payment Mode – Market Size & Forecast 2022-2032, USD Million
- By Region
- Market Size & Outlook
- India Smart Vending Machine Market Outlook, 2022-2032
- Market Size & Outlook
- By Revenues (USD Million)
- Unit Sold (Thousand Units)
- Market Share & Outlook
- By Product Type – Market Size & Forecast 2022-2032, USD Million
- By Machine Configuration– Market Size & Forecast 2022-2032, USD Million
- By Application– Market Size & Forecast 2022-2032, USD Million
- By Payment Mode – Market Size & Forecast 2022-2032, USD Million
- By Region
- Market Size & Outlook
- South Korea Smart Vending Machine Market Outlook, 2022-2032
- Market Size & Outlook
- By Revenues (USD Million)
- Unit Sold (Thousand Units)
- Market Share & Outlook
- By Product Type – Market Size & Forecast 2022-2032, USD Million
- By Machine Configuration– Market Size & Forecast 2022-2032, USD Million
- By Application– Market Size & Forecast 2022-2032, USD Million
- By Payment Mode – Market Size & Forecast 2022-2032, USD Million
- By Region
- Market Size & Outlook
- Singapore Smart Vending Machine Market Outlook, 2022-2032
- Market Size & Outlook
- By Revenues (USD Million)
- Unit Sold (Thousand Units)
- Market Share & Outlook
- By Product Type – Market Size & Forecast 2022-2032, USD Million
- By Machine Configuration– Market Size & Forecast 2022-2032, USD Million
- By Application– Market Size & Forecast 2022-2032, USD Million
- By Payment Mode – Market Size & Forecast 2022-2032, USD Million
- By Region
- Market Size & Outlook
- Indonesia Smart Vending Machine Market Outlook, 2022-2032
- Market Size & Outlook
- By Revenues (USD Million)
- Unit Sold (Thousand Units)
- Market Share & Outlook
- By Product Type – Market Size & Forecast 2022-2032, USD Million
- By Machine Configuration– Market Size & Forecast 2022-2032, USD Million
- By Application– Market Size & Forecast 2022-2032, USD Million
- By Payment Mode – Market Size & Forecast 2022-2032, USD Million
- By Region
- Market Size & Outlook
- Indonesia Smart Vending Machine Market Outlook, 2022-2032
- Market Size & Outlook
- By Revenues (USD Million)
- Unit Sold (Thousand Units)
- Market Share & Outlook
- By Product Type – Market Size & Forecast 2022-2032, USD Million
- By Machine Configuration– Market Size & Forecast 2022-2032, USD Million
- By Application– Market Size & Forecast 2022-2032, USD Million
- By Payment Mode – Market Size & Forecast 2022-2032, USD Million
- By Region
- Market Size & Outlook
- Thailand Smart Vending Machine Market Outlook, 2022-2032
- Market Size & Outlook
- By Revenues (USD Million)
- Unit Sold (Thousand Units)
- Market Share & Outlook
- By Product Type – Market Size & Forecast 2022-2032, USD Million
- By Machine Configuration– Market Size & Forecast 2022-2032, USD Million
- By Application– Market Size & Forecast 2022-2032, USD Million
- By Payment Mode – Market Size & Forecast 2022-2032, USD Million
- By Region
- Market Size & Outlook
- Malaysia Smart Vending Machine Market Outlook, 2022-2032
- Market Size & Outlook
- By Revenues (USD Million)
- Unit Sold (Thousand Units)
- Market Share & Outlook
- By Product Type – Market Size & Forecast 2022-2032, USD Million
- By Machine Configuration– Market Size & Forecast 2022-2032, USD Million
- By Application– Market Size & Forecast 2022-2032, USD Million
- By Payment Mode – Market Size & Forecast 2022-2032, USD Million
- By Region
- Market Size & Outlook
- Vietnam Smart Vending Machine Market Outlook, 2022-2032
- Market Size & Outlook
- By Revenues (USD Million)
- Unit Sold (Thousand Units)
- Market Share & Outlook
- By Product Type – Market Size & Forecast 2022-2032, USD Million
- By Machine Configuration– Market Size & Forecast 2022-2032, USD Million
- By Application– Market Size & Forecast 2022-2032, USD Million
- By Payment Mode – Market Size & Forecast 2022-2032, USD Million
- By Region
- Market Size & Outlook
- Australia Smart Vending Machine Market Outlook, 2022-2032
- Market Size & Outlook
- By Revenues (USD Million)
- Unit Sold (Thousand Units)
- Market Share & Outlook
- By Product Type – Market Size & Forecast 2022-2032, USD Million
- By Machine Configuration– Market Size & Forecast 2022-2032, USD Million
- By Application– Market Size & Forecast 2022-2032, USD Million
- By Payment Mode – Market Size & Forecast 2022-2032, USD Million
- By Region
- Market Size & Outlook
- Philippines Smart Vending Machine Market Outlook, 2022-2032
- Market Size & Outlook
- By Revenues (USD Million)
- Unit Sold (Thousand Units)
- Market Share & Outlook
- By Product Type – Market Size & Forecast 2022-2032, USD Million
- By Machine Configuration– Market Size & Forecast 2022-2032, USD Million
- By Application– Market Size & Forecast 2022-2032, USD Million
- By Payment Mode – Market Size & Forecast 2022-2032, USD Million
- By Region
- Market Size & Outlook
- Asia-Pacific Smart Vending Machine Market Key Strategic Imperatives for Success & Growth
- Competition Outlook
- Company Profiles
- Fuji Electric Co., Ltd.
- Business Description
- Product Portfolio
- Strategic Alliances or Partnerships
- Recent Developments
- Financial Details
- Others
- Silkron Technology Sdn Bhd
- Business Description
- Product Portfolio
- Strategic Alliances or Partnerships
- Recent Developments
- Financial Details
- Others
- Daalchini
- Business Description
- Product Portfolio
- Strategic Alliances or Partnerships
- Recent Developments
- Financial Details
- Others
- Glory Ltd.
- Business Description
- Product Portfolio
- Strategic Alliances or Partnerships
- Recent Developments
- Financial Details
- Others
- Azkoyen
- Business Description
- Product Portfolio
- Strategic Alliances or Partnerships
- Recent Developments
- Financial Details
- Others
- Sanden Holdings Corporation
- Business Description
- Product Portfolio
- Strategic Alliances or Partnerships
- Recent Developments
- Financial Details
- Others
- Crane Co.
- Business Description
- Product Portfolio
- Strategic Alliances or Partnerships
- Recent Developments
- Financial Details
- Others
- Aramark Corporation
- Business Description
- Product Portfolio
- Strategic Alliances or Partnerships
- Recent Developments
- Financial Details
- Others
- Asahi Group Holdings, Ltd.,
- Business Description
- Product Portfolio
- Strategic Alliances or Partnerships
- Recent Developments
- Financial Details
- Others
- Others
- Fuji Electric Co., Ltd.
- Company Profiles
- Disclaimer
MarkNtel Advisors follows a robust and iterative research methodology designed to ensure maximum accuracy and minimize deviation in market estimates and forecasts. Our approach combines both bottom-up and top-down techniques to effectively segment and quantify various aspects of the market. A consistent feature across all our research reports is data triangulation, which examines the market from three distinct perspectives to validate findings. Key components of our research process include:
1. Scope & Research Design At the outset, MarkNtel Advisors define the research objectives and formulate pertinent questions. This phase involves determining the type of research—qualitative or quantitative—and designing a methodology that outlines data collection methods, target demographics, and analytical tools. They also establish timelines and budgets to ensure the research aligns with client goals.
2. Sample Selection and Data Collection In this stage, the firm identifies the target audience and determines the appropriate sample size to ensure representativeness. They employ various sampling methods, such as random or stratified sampling, based on the research objectives. Data collection is carried out using tools like surveys, interviews, and observations, ensuring the gathered data is reliable and relevant.
3. Data Analysis and Validation Once data is collected, MarkNtel Advisors undertake a rigorous analysis process. This includes cleaning the data to remove inconsistencies, employing statistical software for quantitative analysis, and thematic analysis for qualitative data. Validation steps are taken to ensure the accuracy and reliability of the findings, minimizing biases and errors.

4. Data Forecast and FinalizationThe final phase involves forecasting future market trends based on the analyzed data. MarkNtel Advisors utilize predictive modeling and time series analysis to anticipate market behaviors. The insights are then compiled into comprehensive reports, featuring visual aids like charts and graphs, and include strategic recommendations to inform client decision-making
We offer flexible licensing options to cater to varying organizational needs. Choose the pricing pack that best suits your requirements:
Buy Now Inquire Before Buying
 Request Customization
 Talk to our Consultant