
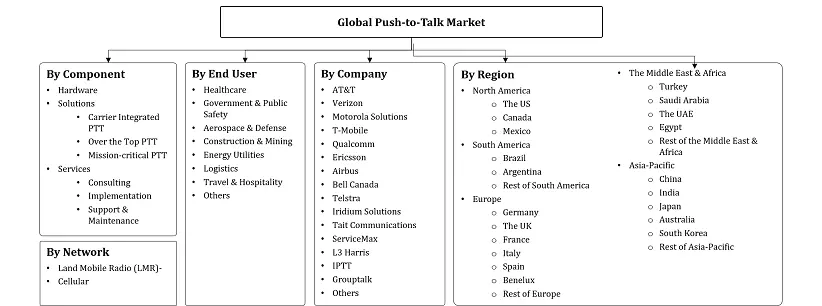
Push-to-Talk Market - By Component (Hardware, Solution, Services), By Network (Land Mobile Radio [LMR], Cellular), By End Users (Aerospace & Defense, Healthcare, Government & Public Safety, Logistics,... ... c Safety, Logistics, Construction & Mining, Energy Utilities, Travel & Hospitality, Others) and others Read more
- ICT & Electronics
- Feb 2024
- 200
- PDF, Excel, PPT
Market Definition
Push-to-Talk (PTT) is a communication process that permits individuals to engage in instant voice communication with the push of a button. It is commonly used in two-way radio communication systems, resembling traditional walkie-talkies. Instead of dialing a phone number and waiting for a connection, users can just press a button to broadcast their message to a specific group or individual in real-time.
Market Insights & Analysis: Global Push-to-Talk Market (2024-30):
The Global Push-to-Talk (PTT) Market size was valued at USD 28.76 billion in 2023 and is estimated to grow at a CAGR of around 10.21% during the forecast period, i.e., 2024-30. The market is witnessing substantial growth due to the escalating demand for instant communication solutions across diverse industries. In sectors like public safety, construction, and transportation, where real-time communication is crucial, PTT technology provides a reliable & efficient means of coordination. The necessity for enhanced communication capabilities in the era of remote work and globalized supply chains further amplifies this demand. The widespread adoption of smartphones and other mobile devices serves as a significant driver for the PTT market, given their omnipresence in both professional and personal settings.
| Report Coverage | Details |
|---|---|
| Study Period | Historical Data: 2019-22 |
| Base Year: 2023 | |
| Forecast Period: 2024-30 | |
| CAGR (2024-2030) | 10.21% |
| Regions Covered | North America: US, Canada, Mexico |
| Europe: Germany, France, Italy, The UK, Spain, Benelux , Rest of Europe | |
| Asia-Pacific: China, India, Japan, South Korea, Australia, Rest of Asia-Pacific | |
| South America: Brazil, Argentina, Rest of South America | |
| Middle East & Africa: Turkey, The UAE, Saudi Arabia, Egypt, Rest of the Middle East & Africa | |
| Key Companies Profiled | &T, Verizon, Motorola Solutions, T-Mobile, Qualcomm, Ericsson, Airbus, Bell Canada, Telstra, Iridium Solutions, Tait Communications, ServiceMax, L3 Harris, IPTT, Grouptalk and Others |
| Market Value (2023) | USD 28.76 Billion |
The market experiences a notable upswing, particularly fueled by increased demand in public safety & emergency response scenarios. Government agencies, law enforcement, and first responders heavily rely on PTT systems for efficient coordination during critical situations, providing swift & dependable communication. These systems continually undergo enhancements to meet the specific and evolving requirements of these essential sectors. The industry is witnessing substantial growth as hybrid communication solutions gain prominence, with PTT systems seamlessly integrating with existing communication networks and platforms, appealing to businesses and organizations.
These solutions offer unified communication across various channels, enhancing flexibility & interoperability. This adaptability aligns well with the evolving communication needs of modern enterprises. Additionally, the potential for the market is poised to escalate significantly with the emergence of the Internet of Things (IoT), Artificial Intelligence (AI), natural language processing, and the growing prevalence of online applications. Nevertheless, the anticipated hindrance to the growth of the Push-to-Talk Market in the forecast period is the substantial capital investment necessary for the deployment of communication infrastructure, specifically the land mobile radio network type.
- Introduction
- Product Definition
- Research Process
- Assumptions
- Market Segmentation
- Executive Summary
- Global Push-to-Talk Trends & Insights
- Global Push-to-Talk Dynamics
- Growth Drivers
- Challenges
- Global Push-to-Talk Policies & Regulations
- Global Push-to-Talk Hotspot & Opportunities
- Global Push-to-Talk Outlook, 2019-2030F
- Market Size & Analysis
- By Revenue (USD Million)
- Market Share & Analysis
- By Component
- Hardware- Market Size & Forecast 2019-2030, (USD Million)
- Solution- Market Size & Forecast 2019-2030, (USD Million)
- Carrier Integrated PTT
- Over the Top PTT
- Mission-critical PTT
- Services- Market Size & Forecast 2019-2030, (USD Million)
- Consulting
- Implementation
- Support & Maintenance
- By Network
- Land Mobile Radio (LMR)- Market Size & Forecast 2019-2030, (USD Million)
- Cellular - Market Size & Forecast 2019-2030, (USD Million)
- By End Users
- Aerospace & Defense- Market Size & Forecast 2019-2030, (USD Million)
- Healthcare- Market Size & Forecast 2019-2030, (USD Million)
- Government & Public Safety- Market Size & Forecast 2019-2030, (USD Million)
- Logistics- Market Size & Forecast 2019-2030, (USD Million)
- Construction & Mining- Market Size & Forecast 2019-2030, (USD Million)
- Energy Utilities- Market Size & Forecast 2019-2030, (USD Million)
- Travel & Hospitality - Market Size & Forecast 2019-2030, (USD Million)
- Others
- By Region
- North America
- South America
- Europe
- The Middle East & Africa
- Asia-Pacific
- By Company
- Competitor Characteristics
- Revenue Shares
- By Component
- Market Size & Analysis
- North America Push-to-Talk Outlook, 2019-2030F
- Market Size & Analysis
- By Revenue (USD Million)
- Market Share & Analysis
- By Component- Market Size & Forecast 2019-2030, (USD Million)
- By Network- Market Size & Forecast 2019-2030, (USD Million)
- By End Users- Market Size & Forecast 2019-2030, (USD Million)
- By Country
- The US
- Canada
- Mexico
- The US Push-to-Talk Outlook, 2019-2030F
- Market Size & Analysis
- By Revenue (USD Million)
- Market Share & Analysis
- By Component- Market Size & Forecast 2019-2030, (USD Million)
- By Network- Market Size & Forecast 2019-2030, (USD Million)
- By End Users- Market Size & Forecast 2019-2030, (USD Million)
- Market Size & Analysis
- Canada Push-to-Talk Outlook, 2019-2030F
- Market Size & Analysis
- By Revenue (USD Million)
- Market Share & Analysis
- By Component- Market Size & Forecast 2019-2030, (USD Million)
- By Network- Market Size & Forecast 2019-2030, (USD Million)
- By End Users- Market Size & Forecast 2019-2030, (USD Million)
- Market Size & Analysis
- Mexico Push-to-Talk Outlook, 2019-2030F
- Market Size & Analysis
- By Revenue (USD Million)
- Market Share & Analysis
- By Component- Market Size & Forecast 2019-2030, (USD Million)
- By Network- Market Size & Forecast 2019-2030, (USD Million)
- By End Users- Market Size & Forecast 2019-2030, (USD Million)
- Market Size & Analysis
- Market Size & Analysis
- South America Push-to-Talk Outlook, 2019-2030F
- Market Size & Analysis
- By Revenue (USD Million)
- Market Share & Analysis
- By Component- Market Size & Forecast 2019-2030, (USD Million)
- By Network- Market Size & Forecast 2019-2030, (USD Million)
- By End Users- Market Size & Forecast 2019-2030, (USD Million)
- By Country
- Brazil
- Argentina
- Rest of South America
- Brazil Push-to-Talk Outlook, 2019-2030F
- Market Size & Analysis
- By Revenue (USD Million)
- Market Share & Analysis
- By Component- Market Size & Forecast 2019-2030, (USD Million)
- By Network- Market Size & Forecast 2019-2030, (USD Million)
- By End Users- Market Size & Forecast 2019-2030, (USD Million)
- Market Size & Analysis
- Argentina Push-to-Talk Outlook, 2019-2030F
- Market Size & Analysis
- By Revenue (USD Million)
- Market Share & Analysis
- By Component- Market Size & Forecast 2019-2030, (USD Million)
- By Network- Market Size & Forecast 2019-2030, (USD Million)
- By End Users- Market Size & Forecast 2019-2030, (USD Million)
- Market Size & Analysis
- Market Size & Analysis
- Europe Push-to-Talk Outlook, 2019-2030F
- Market Size & Analysis
- By Revenue (USD Million)
- Market Share & Analysis
- By Component- Market Size & Forecast 2019-2030, (USD Million)
- By Network- Market Size & Forecast 2019-2030, (USD Million)
- By End Users- Market Size & Forecast 2019-2030, (USD Million)
- By Country
- Germany
- France
- Italy
- The UK
- Spain
- Benelux
- Rest of Europe
- Germany Push-to-Talk Outlook, 2019-2030F
- Market Size & Analysis
- By Revenue (USD Million)
- Market Share & Analysis
- By Component- Market Size & Forecast 2019-2030, (USD Million)
- By Network- Market Size & Forecast 2019-2030, (USD Million)
- By End Users- Market Size & Forecast 2019-2030, (USD Million)
- Market Size & Analysis
- France Push-to-Talk Outlook, 2019-2030F
- Market Size & Analysis
- By Revenue (USD Million)
- Market Share & Analysis
- By Component- Market Size & Forecast 2019-2030, (USD Million)
- By Network- Market Size & Forecast 2019-2030, (USD Million)
- By End Users- Market Size & Forecast 2019-2030, (USD Million)
- Market Size & Analysis
- Italy Push-to-Talk Outlook, 2019-2030F
- Market Size & Analysis
- By Revenue (USD Million)
- Market Share & Analysis
- By Component- Market Size & Forecast 2019-2030, (USD Million)
- By Network- Market Size & Forecast 2019-2030, (USD Million)
- By End Users- Market Size & Forecast 2019-2030, (USD Million)
- Market Size & Analysis
- The UK Push-to-Talk Outlook, 2019-2030F
- Market Size & Analysis
- By Revenue (USD Million)
- Market Share & Analysis
- By Component- Market Size & Forecast 2019-2030, (USD Million)
- By Network- Market Size & Forecast 2019-2030, (USD Million)
- By End Users- Market Size & Forecast 2019-2030, (USD Million)
- Market Size & Analysis
- Spain Push-to-Talk Outlook, 2019-2030F
- Market Size & Analysis
- By Revenue (USD Million)
- Market Share & Analysis
- By Component- Market Size & Forecast 2019-2030, (USD Million)
- By Network- Market Size & Forecast 2019-2030, (USD Million)
- By End Users- Market Size & Forecast 2019-2030, (USD Million)
- Market Size & Analysis
- Benelux Push-to-Talk Outlook, 2019-2030F
- Market Size & Analysis
- By Revenue (USD Million)
- Market Share & Analysis
- By Component- Market Size & Forecast 2019-2030, (USD Million)
- By Network- Market Size & Forecast 2019-2030, (USD Million)
- By End Users- Market Size & Forecast 2019-2030, (USD Million)
- Market Size & Analysis
- Market Size & Analysis
- The Middle East & Africa Push-to-Talk Outlook, 2019-2030F
- Market Size & Analysis
- By Revenue (USD Million)
- Market Share & Analysis
- By Component- Market Size & Forecast 2019-2030, (USD Million)
- By Network- Market Size & Forecast 2019-2030, (USD Million)
- By End Users- Market Size & Forecast 2019-2030, (USD Million)
- By Country
- Turkey
- The UAE
- Saudi Arabia
- Egypt
- Rest of the Middle East & Africa
- Turkey Push-to-Talk Outlook, 2019-2030F
- Market Size & Analysis
- By Revenue (USD Million)
- Market Share & Analysis
- By Component- Market Size & Forecast 2019-2030, (USD Million)
- By Network- Market Size & Forecast 2019-2030, (USD Million)
- By End Users- Market Size & Forecast 2019-2030, (USD Million)
- Market Size & Analysis
- The UAE Push-to-Talk Outlook, 2019-2030F
- Market Size & Analysis
- By Revenue (USD Million)
- Market Share & Analysis
- By Component- Market Size & Forecast 2019-2030, (USD Million)
- By Network- Market Size & Forecast 2019-2030, (USD Million)
- By End Users- Market Size & Forecast 2019-2030, (USD Million)
- Market Size & Analysis
- Saudi Arabia Push-to-Talk Outlook, 2019-2030F
- Market Size & Analysis
- By Revenue (USD Million)
- Market Share & Analysis
- By Component- Market Size & Forecast 2019-2030, (USD Million)
- By Network- Market Size & Forecast 2019-2030, (USD Million)
- By End Users- Market Size & Forecast 2019-2030, (USD Million)
- Market Size & Analysis
- Egypt Push-to-Talk Outlook, 2019-2030F
- Market Size & Analysis
- By Revenue (USD Million)
- Market Share & Analysis
- By Component- Market Size & Forecast 2019-2030, (USD Million)
- By Network- Market Size & Forecast 2019-2030, (USD Million)
- By End Users- Market Size & Forecast 2019-2030, (USD Million)
- Market Size & Analysis
- Market Size & Analysis
- Asia-Pacific Push-to-Talk Outlook, 2019-2030F
- Market Size & Analysis
- By Revenue (USD Million)
- Market Share & Analysis
- By Component- Market Size & Forecast 2019-2030, (USD Million)
- By Network- Market Size & Forecast 2019-2030, (USD Million)
- By End Users- Market Size & Forecast 2019-2030, (USD Million))
- By Country
- China
- Japan
- India
- Australia
- South Korea
- Rest of Asia-Pacific
- China Push-to-Talk Outlook, 2019-2030F
- Market Size & Analysis
- By Revenue (USD Million)
- Market Share & Analysis
- By Component- Market Size & Forecast 2019-2030, (USD Million)
- By Network- Market Size & Forecast 2019-2030, (USD Million)
- By End Users- Market Size & Forecast 2019-2030, (USD Million)
- Market Size & Analysis
- Japan Push-to-Talk Outlook, 2019-2030F
- Market Size & Analysis
- By Revenue (USD Million)
- Market Share & Analysis
- By Component- Market Size & Forecast 2019-2030, (USD Million)
- By Network- Market Size & Forecast 2019-2030, (USD Million)
- By End Users- Market Size & Forecast 2019-2030, (USD Million)
- Market Size & Analysis
- India Push-to-Talk Outlook, 2019-2030F
- Market Size & Analysis
- By Revenue (USD Million)
- Market Share & Analysis
- By Component- Market Size & Forecast 2019-2030, (USD Million)
- By Network- Market Size & Forecast 2019-2030, (USD Million)
- By End Users- Market Size & Forecast 2019-2030, (USD Million)
- Market Size & Analysis
- Australia Push-to-Talk Outlook, 2019-2030F
- Market Size & Analysis
- By Revenue (USD Million)
- Market Share & Analysis
- By Component- Market Size & Forecast 2019-2030, (USD Million)
- By Network- Market Size & Forecast 2019-2030, (USD Million)
- By End Users- Market Size & Forecast 2019-2030, (USD Million)
- Market Size & Analysis
- South Korea Push-to-Talk Outlook, 2019-2030F
- Market Size & Analysis
- By Revenue (USD Million)
- Market Share & Analysis
- By Component- Market Size & Forecast 2019-2030, (USD Million)
- By Network- Market Size & Forecast 2019-2030, (USD Million)
- By End Users- Market Size & Forecast 2019-2030, (USD Million)
- Market Size & Analysis
- Market Size & Analysis
- Global Push-to-Talk Key Strategic Imperatives for Growth & Success
- Competition Outlook
- Company Profiles
- AT&T
- Business Description
- Product Segments
- Strategic Alliances or Partnerships
- Recent Developments
- Financial Details
- Others
- Verizon
- Business Description
- Product Segments
- Strategic Alliances or Partnerships
- Recent Developments
- Financial Details
- Others
- Motorola Solutions
- Business Description
- Product Segments
- Strategic Alliances or Partnerships
- Recent Developments
- Financial Details
- Others
- T-Mobile
- Business Description
- Product Segments
- Strategic Alliances or Partnerships
- Recent Developments
- Financial Details
- Others
- Qualcomm
- Business Description
- Product Segments
- Strategic Alliances or Partnerships
- Recent Developments
- Financial Details
- Others
- Ericsson
- Business Description
- Product Segments
- Strategic Alliances or Partnerships
- Recent Developments
- Financial Details
- Others
- Airbus
- Business Description
- Product Segments
- Strategic Alliances or Partnerships
- Recent Developments
- Financial Details
- Others
- Bell Canada
- Business Description
- Product Segments
- Strategic Alliances or Partnerships
- Recent Developments
- Financial Details
- Others
- Telstra
- Business Description
- Product Segments
- Strategic Alliances or Partnerships
- Recent Developments
- Financial Details
- Others
- Iridium Solutions
- Business Description
- Product Segments
- Strategic Alliances or Partnerships
- Recent Developments
- Financial Details
- Others
- Tait Communications
- Business Description
- Product Segments
- Strategic Alliances or Partnerships
- Recent Developments
- Financial Details
- Others
- ServiceMax
- Business Description
- Product Segments
- Strategic Alliances or Partnerships
- Recent Developments
- Financial Details
- Others
- L3 Harris
- Business Description
- Product Segments
- Strategic Alliances or Partnerships
- Recent Developments
- Financial Details
- Others
- IPTT
- Business Description
- Product Segments
- Strategic Alliances or Partnerships
- Recent Developments
- Financial Details
- Others
- Grouptalk
- Business Description
- Product Segments
- Strategic Alliances or Partnerships
- Recent Developments
- Financial Details
- Others
- Others
- AT&T
- Company Profiles
- Disclaimer
MarkNtel Advisors follows a robust and iterative research methodology designed to ensure maximum accuracy and minimize deviation in market estimates and forecasts. Our approach combines both bottom-up and top-down techniques to effectively segment and quantify various aspects of the market. A consistent feature across all our research reports is data triangulation, which examines the market from three distinct perspectives to validate findings. Key components of our research process include:
1. Scope & Research Design At the outset, MarkNtel Advisors define the research objectives and formulate pertinent questions. This phase involves determining the type of research—qualitative or quantitative—and designing a methodology that outlines data collection methods, target demographics, and analytical tools. They also establish timelines and budgets to ensure the research aligns with client goals.
2. Sample Selection and Data Collection In this stage, the firm identifies the target audience and determines the appropriate sample size to ensure representativeness. They employ various sampling methods, such as random or stratified sampling, based on the research objectives. Data collection is carried out using tools like surveys, interviews, and observations, ensuring the gathered data is reliable and relevant.
3. Data Analysis and Validation Once data is collected, MarkNtel Advisors undertake a rigorous analysis process. This includes cleaning the data to remove inconsistencies, employing statistical software for quantitative analysis, and thematic analysis for qualitative data. Validation steps are taken to ensure the accuracy and reliability of the findings, minimizing biases and errors.

4. Data Forecast and FinalizationThe final phase involves forecasting future market trends based on the analyzed data. MarkNtel Advisors utilize predictive modeling and time series analysis to anticipate market behaviors. The insights are then compiled into comprehensive reports, featuring visual aids like charts and graphs, and include strategic recommendations to inform client decision-making
We offer flexible licensing options to cater to varying organizational needs. Choose the pricing pack that best suits your requirements:
Buy Now