
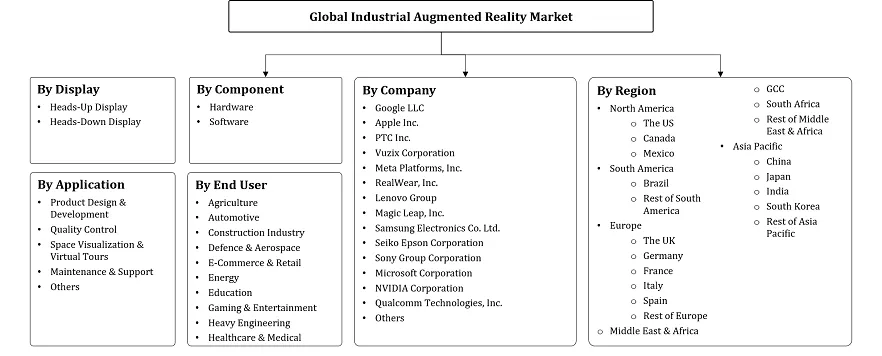
Industrial Augmented Reality Market - By Component (Hardware, Software), By Display (Heads-Up Display, Heads Mounted Display), By Application (Product Design & Development, Quality Control, Space Visu... ... Control, Space Visualization & Virtual Tours, Maintenance & Support, Others), By End User (Agriculture, Automotive, Construction Industry, Defence & Aerospace, E-Commerce & Retail, Energy, Education, Gaming & Entertainment, Heavy Engineering, Healthcare & Medical) and Others Read more
- ICT & Electronics
- Nov 2024
- 211
- PDF, Excel, PPT
Market Definition
Augmented industrial reality refers to integrating advanced technology into industrial operations, to streamline processes, foster innovation, and enhance industrial productivity with worker capabilities, and safety assurance. This can also facilitate time management by reducing unwanted expenses such as training costs, whether manufacturing, logistics, or product design. With AR, manufacturing companies can achieve higher levels of automation, enabling real-time visualization of data.
Market Insights & Analysis: Global Industrial Augmented Reality Market (2025-30):
The Global Industrial Augmented Reality Market size was valued at around USD 80.37 billion in 2024 and is projected to reach USD 631 billion by 2030. Along with this, the market is estimated to grow at a CAGR of around 41% during the forecast period, i.e., 2025-30. The market growth is primarily driven by surging demand for reducing workflow complexity & enhancing work optimization entwined with the growing need for a technology to track, identify, and resolve technical issues. In addition to this, augmented reality is beneficial in assembling, retrofitting, repairing production lines, and manufacturing processes, coupled with training, integration with IoT devices, quality control, and improved remote assistance.
| Report Coverage | Details |
|---|---|
| Historical Years | 2020-23 |
|
Base Years
|
2024
|
|
Forecast Years
|
2025-30
|
| Market Value in 2024 | USD 80.37 Billion |
| Market Value in 2030 | USD 631 Billion |
| CAGR (2025-30) | 41% |
| Leading Region | Asia-Pacific |
| Top Key Players | Google LLC, Apple Inc., PTC Inc., Vuzix Corporation, Meta Platforms, Inc., RealWear, Inc., Lenovo Group, Magic Leap, Inc., Samsung Electronics Co. Ltd., Seiko Epson Corporation, Sony Group Corporation, Microsoft Corporation, NVIDIA Corporation, Qualcomm Technologies, Inc., and Others |
| Key Report Highlights |
|
*Boost strategic growth with in-depth market analysis - Get a free sample preview today!
Moreover, the rising trends such as sustainability and eco-friendly practices, augmented training and skill development, augmented maintenance & support, security and privacy enhancements, customized & scalable solutions, seek comprehensive attention from large industrialists and therefore resulted in the growing adoption of Industrial augment reality solutions. Industries such as aerospace, automotive, and healthcare sectors, which comprise the complex production process are integrating AR into their operations to efficiently manage their workflow. With this rising number of industry players, the market is expected to achieve extensive adoption of these technologies. Therefore, estimated to boost the Global industrial augmented reality market growth in the next few years.
Furthermore, the growing organization seeks to transform productivity by accessing instant, actionable insights, augments the requirement for real-time data further fuels market growth. In addition to this, with the growing trend, the rising inclination of major companies toward innovative technology further accelerates the industry expansion. Such as Magic Leap’s ActiveSphere concept UI in cars, is an augmented reality user interface designed to be configurable and enhance the driver’s connection to the car.
- Market Segmentation
- Introduction
- Product Definition
- Research Process
- Assumptions
- Executive Summary
- Global Industrial Augmented Reality Market Government Regulations
- Global Industrial Augmented Reality Market Trends & Insights
- Global Industrial Augmented Reality Market Dynamics
- Growth Drivers
- Challenges
- Global Industrial Augmented Reality Market Hotspot & Opportunities
- Global Industrial Augmented Reality Market Start-up Ecosystem, 2020-2023
- Entrepreneurial Activity
- Year On Year Funding Received
- Funding Received by Top Companies
- Key Investors Active in the Market
- Series Wise Funding Received
- Seed Funding
- Angel Investing
- Venture Capital
- Others
- Global Industrial Augmented Reality Market Outlook, 2020-2030F
- Market Size & Analysis
- By Revenue (USD Million)
- Market Share & Analysis
- By Component
- Hardware- Market Size & Forecast 2020-2030, USD Million
- Software- Market Size & Forecast 2020-2030, USD Million
- By Display
- Heads-Up Display- Market Size & Forecast 2020-2030, USD Million
- Heads Mounted Display- Market Size & Forecast 2020-2030, USD Million
- By Application
- Product Design & Development- Market Size & Forecast 2020-2030, USD Million
- Quality Control- Market Size & Forecast 2020-2030, USD Million
- Space Visualization & Virtual Tours - Market Size & Forecast 2020-2030, USD Million
- Maintenance & Support- Market Size & Forecast 2020-2030, USD Million
- Others (Training, etc.)- Market Size & Forecast 2020-2030, USD Million
- By End User
- Agriculture- Market Size & Forecast 2020-2030, USD Million
- Automotive- Market Size & Forecast 2020-2030, USD Million
- Construction Industry- Market Size & Forecast 2020-2030, USD Million
- Defence & Aerospace- Market Size & Forecast 2020-2030, USD Million
- E-Commerce & Retail- Market Size & Forecast 2020-2030, USD Million
- Energy- Market Size & Forecast 2020-2030, USD Million
- Education- Market Size & Forecast 2020-2030, USD Million
- Gaming & Entertainment- Market Size & Forecast 2020-2030, USD Million
- Heavy Engineering - Market Size & Forecast 2020-2030, USD Million
- Healthcare & Medical- Market Size & Forecast 2020-2030, USD Million
- Others- Market Size & Forecast 2020-2030, USD Million
- By Region
- North America
- South America
- Europe
- Middle East & Africa
- Asia Pacific
- By Component
- Market Size & Analysis
- North America Industrial Augmented Reality Market Outlook, 2020-2030F
- Market Size & Analysis
- By Revenue (USD Million)
- Market Share & Analysis
- By Component- Market Size & Forecast 2020-2030, USD Million
- By Display- Market Size & Forecast 2020-2030, USD Million
- By Application- Market Size & Forecast 2020-2030, USD Million
- By End User- Market Size & Forecast 2020-2030, USD Million
- By Country
- The US
- Canada
- Mexico
- The US Industrial Augmented Reality Market Outlook, 2020-2030F
- Market Size & Analysis
- By Revenue (USD Million)
- Market Share & Analysis
- By Component- Market Size & Forecast 2020-2030, USD Million
- By End User- Market Size & Forecast 2020-2030, USD Million
- Market Size & Analysis
- Canada Industrial Augmented Reality Market Outlook, 2020-2030F
- Market Size & Analysis
- By Revenue (USD Million)
- Market Share & Analysis
- By Component- Market Size & Forecast 2020-2030, USD Million
- By End User- Market Size & Forecast 2020-2030, USD Million
- Market Size & Analysis
- Mexico Industrial Augmented Reality Market Outlook, 2020-2030F
- Market Size & Analysis
- By Revenue (USD Million)
- Market Share & Analysis
- By Component- Market Size & Forecast 2020-2030, USD Million
- By End User- Market Size & Forecast 2020-2030, USD Million
- Market Size & Analysis
- Market Size & Analysis
- South America Industrial Augmented Reality Market Outlook, 2020-2030F
- Market Size & Analysis
- By Revenue (USD Million)
- Market Share & Analysis
- By Component- Market Size & Forecast 2020-2030, USD Million
- By Display- Market Size & Forecast 2020-2030, USD Million
- By Application- Market Size & Forecast 2020-2030, USD Million
- By End User- Market Size & Forecast 2020-2030, USD Million
- By Country
- Brazil
- Rest of South America
- Brazil Industrial Augmented Reality Market Outlook, 2020-2030F
- Market Size & Analysis
- By Revenue (USD Million)
- Market Share & Analysis
- By Component- Market Size & Forecast 2020-2030, USD Million
- By End User- Market Size & Forecast 2020-2030, USD Million
- Market Size & Analysis
- Market Size & Analysis
- Europe Industrial Augmented Reality Market Outlook, 2020-2030F
- Market Size & Analysis
- By Revenue (USD Million)
- Market Share & Analysis
- By Component- Market Size & Forecast 2020-2030, USD Million
- By Display- Market Size & Forecast 2020-2030, USD Million
- By Application- Market Size & Forecast 2020-2030, USD Million
- By End User- Market Size & Forecast 2020-2030, USD Million
- By Country
- The UK
- Germany
- France
- Italy
- Spain
- Rest of Europe
- The UK Industrial Augmented Reality Market Outlook, 2020-2030F
- Market Size & Analysis
- By Revenue (USD Million)
- Market Share & Analysis
- By Component- Market Size & Forecast 2020-2030, USD Million
- By End User- Market Size & Forecast 2020-2030, USD Million
- Market Size & Analysis
- Germany Industrial Augmented Reality Market Outlook, 2020-2030F
- Market Size & Analysis
- By Revenue (USD Million)
- Market Share & Analysis
- By Component- Market Size & Forecast 2020-2030, USD Million
- By End User- Market Size & Forecast 2020-2030, USD Million
- Market Size & Analysis
- France Industrial Augmented Reality Market Outlook, 2020-2030F
- Market Size & Analysis
- By Revenue (USD Million)
- Market Share & Analysis
- By Component- Market Size & Forecast 2020-2030, USD Million
- By End User- Market Size & Forecast 2020-2030, USD Million
- Market Size & Analysis
- Italy Industrial Augmented Reality Market Outlook, 2020-2030F
- Market Size & Analysis
- By Revenue (USD Million)
- Market Share & Analysis
- By Component- Market Size & Forecast 2020-2030, USD Million
- By End User- Market Size & Forecast 2020-2030, USD Million
- Market Size & Analysis
- Spain Industrial Augmented Reality Market Outlook, 2020-2030F
- Market Size & Analysis
- By Revenue (USD Million)
- Market Share & Analysis
- By Component- Market Size & Forecast 2020-2030, USD Million
- By End User- Market Size & Forecast 2020-2030, USD Million
- Market Size & Analysis
- Market Size & Analysis
- Middle East & Africa Industrial Augmented Reality Market Outlook, 2020-2030F
- Market Size & Analysis
- By Revenue (USD Million)
- Market Share & Analysis
- By Component- Market Size & Forecast 2020-2030, USD Million
- By Display- Market Size & Forecast 2020-2030, USD Million
- By Application- Market Size & Forecast 2020-2030, USD Million
- By End User- Market Size & Forecast 2020-2030, USD Million
- By Country
- GCC
- South Africa
- Rest of Middle East & Africa
- GCC Industrial Augmented Reality Market Outlook, 2020-2030F
- Market Size & Analysis
- By Revenue (USD Million)
- Market Share & Analysis
- By Component- Market Size & Forecast 2020-2030, USD Million
- By End User- Market Size & Forecast 2020-2030, USD Million
- Market Size & Analysis
- South Africa Industrial Augmented Reality Market Outlook, 2020-2030F
- Market Size & Analysis
- By Revenue (USD Million)
- Market Share & Analysis
- By Component- Market Size & Forecast 2020-2030, USD Million
- By End User- Market Size & Forecast 2020-2030, USD Million
- Market Size & Analysis
- Market Size & Analysis
- Asia Pacific Industrial Augmented Reality Market Outlook, 2020-2030F
- Market Size & Analysis
- By Revenue (USD Million)
- Market Share & Analysis
- By Component- Market Size & Forecast 2020-2030, USD Million
- By Display- Market Size & Forecast 2020-2030, USD Million
- By Application- Market Size & Forecast 2020-2030, USD Million
- By End User- Market Size & Forecast 2020-2030, USD Million
- By Country
- India
- China
- Japan
- South Korea
- Rest of Asia Pacific
- India Industrial Augmented Reality Market Outlook, 2020-2030F
- Market Size & Analysis
- By Revenue (USD Million)
- Market Share & Analysis
- By Component- Market Size & Forecast 2020-2030, USD Million
- By End User- Market Size & Forecast 2020-2030, USD Million
- Market Size & Analysis
- China Industrial Augmented Reality Market Outlook, 2020-2030F
- Market Size & Analysis
- By Revenue (USD Million)
- Market Share & Analysis
- By Component- Market Size & Forecast 2020-2030, USD Million
- By End User- Market Size & Forecast 2020-2030, USD Million
- Market Size & Analysis
- Japan Industrial Augmented Reality Market Outlook, 2020-2030F
- Market Size & Analysis
- By Revenue (USD Million)
- Market Share & Analysis
- By Component- Market Size & Forecast 2020-2030, USD Million
- By End User- Market Size & Forecast 2020-2030, USD Million
- Market Size & Analysis
- South Korea Industrial Augmented Reality Market Outlook, 2020-2030F
- Market Size & Analysis
- By Revenue (USD Million)
- Market Share & Analysis
- By Component- Market Size & Forecast 2020-2030, USD Million
- By End User- Market Size & Forecast 2020-2030, USD Million
- Market Size & Analysis
- Market Size & Analysis
- Global Industrial Augmented Reality Market Key Strategic Imperatives for Success & Growth
- Competition Outlook
- Company Profiles
- Google LLC
- Business Description
- Product Portfolio
- Strategic Alliances or Partnerships
- Recent Developments
- Financial Details
- Others
- Apple Inc.
- Business Description
- Product Portfolio
- Strategic Alliances or Partnerships
- Recent Developments
- Financial Details
- Others
- PTC Inc.
- Business Description
- Product Portfolio
- Strategic Alliances or Partnerships
- Recent Developments
- Financial Details
- Others
- Vuzix Corporation
- Business Description
- Product Portfolio
- Strategic Alliances or Partnerships
- Recent Developments
- Financial Details
- Others
- Meta Platforms, Inc.
- Business Description
- Product Portfolio
- Strategic Alliances or Partnerships
- Recent Developments
- Financial Details
- Others
- RealWear, Inc.
- Business Description
- Product Portfolio
- Strategic Alliances or Partnerships
- Recent Developments
- Financial Details
- Others
- Lenovo Group
- Business Description
- Product Portfolio
- Strategic Alliances or Partnerships
- Recent Developments
- Financial Details
- Others
- Magic Leap, Inc.
- Business Description
- Product Portfolio
- Strategic Alliances or Partnerships
- Recent Developments
- Financial Details
- Others
- Samsung Electronics Co. Ltd.
- Business Description
- Product Portfolio
- Strategic Alliances or Partnerships
- Recent Developments
- Financial Details
- Others
- Seiko Epson Corporation
- Business Description
- Product Portfolio
- Strategic Alliances or Partnerships
- Recent Developments
- Financial Details
- Others
- Sony Group Corporation
- Business Description
- Product Portfolio
- Strategic Alliances or Partnerships
- Recent Developments
- Financial Details
- Others
- Microsoft Corporation
- Business Description
- Product Portfolio
- Strategic Alliances or Partnerships
- Recent Developments
- Financial Details
- Others
- NVIDIA Corporation
- Business Description
- Product Portfolio
- Strategic Alliances or Partnerships
- Recent Developments
- Financial Details
- Others
- Qualcomm Technologies, Inc.
- Business Description
- Product Portfolio
- Strategic Alliances or Partnerships
- Recent Developments
- Financial Details
- Others
- Others
- Google LLC
- Company Profiles
- Disclaimer
MarkNtel Advisors follows a robust and iterative research methodology designed to ensure maximum accuracy and minimize deviation in market estimates and forecasts. Our approach combines both bottom-up and top-down techniques to effectively segment and quantify various aspects of the market. A consistent feature across all our research reports is data triangulation, which examines the market from three distinct perspectives to validate findings. Key components of our research process include:
1. Scope & Research Design At the outset, MarkNtel Advisors define the research objectives and formulate pertinent questions. This phase involves determining the type of research—qualitative or quantitative—and designing a methodology that outlines data collection methods, target demographics, and analytical tools. They also establish timelines and budgets to ensure the research aligns with client goals.
2. Sample Selection and Data Collection In this stage, the firm identifies the target audience and determines the appropriate sample size to ensure representativeness. They employ various sampling methods, such as random or stratified sampling, based on the research objectives. Data collection is carried out using tools like surveys, interviews, and observations, ensuring the gathered data is reliable and relevant.
3. Data Analysis and Validation Once data is collected, MarkNtel Advisors undertake a rigorous analysis process. This includes cleaning the data to remove inconsistencies, employing statistical software for quantitative analysis, and thematic analysis for qualitative data. Validation steps are taken to ensure the accuracy and reliability of the findings, minimizing biases and errors.

4. Data Forecast and FinalizationThe final phase involves forecasting future market trends based on the analyzed data. MarkNtel Advisors utilize predictive modeling and time series analysis to anticipate market behaviors. The insights are then compiled into comprehensive reports, featuring visual aids like charts and graphs, and include strategic recommendations to inform client decision-making
We offer flexible licensing options to cater to varying organizational needs. Choose the pricing pack that best suits your requirements:
Buy Now