
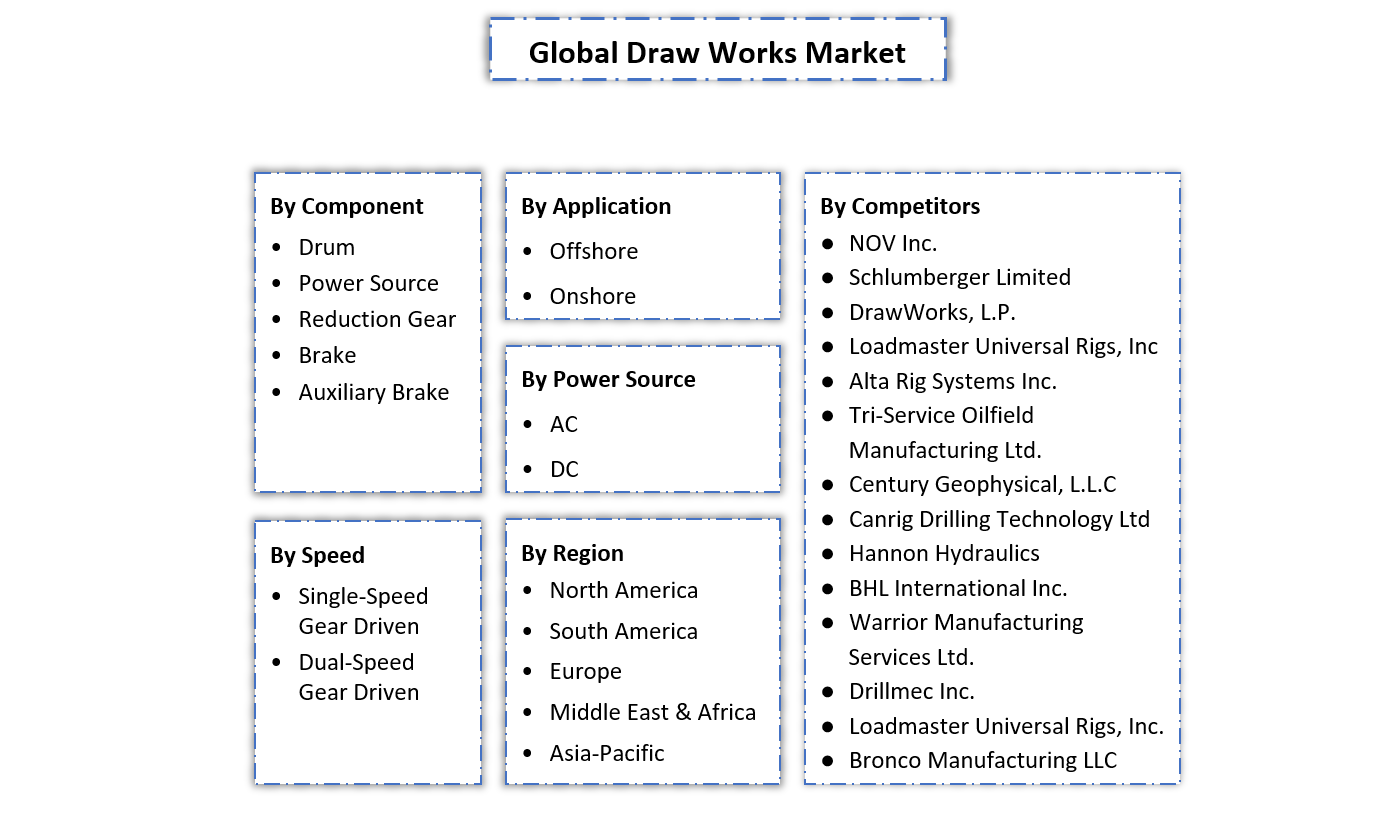
Draw Works Market Report- By Component (Drum, Power Source, Reduction Gear, Brake, Auxiliary Brake, Others), By Power Source (AC, DC), By Application (Offshore, Onshore), By Speed (Single Speed Gear D... ... (Single Speed Gear Driven, Dual Speed Gear Driven), By Region (North America, South America, Europe, Asia-Pacific, The Middle East and Africa), By Company (National Oilwell Varco Inc., Schlumberger Limited, DrawWorks, L.P., Loadmaster Universal Rigs, Inc, Drillmec India Pvt Ltd, Alta Rig Systems Inc., Tri-Service Oilfield Manufacturing Ltd., Century Geophysical, L.L.C, Canrig Drilling Technology Ltd, Hannon Hydraulics, BHL International Inc., Warrior Manufacturing Services Ltd., Drillmec Inc., Loadmaster Universal Rigs, Inc., Bronco Manufacturing LLC) Read more
- Energy
- May 2023
- 180
- PDF, Excel, PPT
Market Definition
Draw works equipment is a crucial component of drilling rigs used in the oil & gas industry. It provides the mechanical power necessary for the hoisting & lowering of the drill string & other drilling operations. The key components of draw works equipment include a drum, brake system, power system, control system, and crown & traveling blocks, among others.
Market Insights & Analysis: Global Draw Works Market (2023-28)
The Global Draw Works Market is projected to grow at a considerable CAGR during the forecast period, i.e., 2023-28. The growth of the market would be propelled mainly by the ever-increasing oil & gas exploration activities across different regions worldwide, rising deepwater & ultra-deepwater exploration, and technological advancements in drilling technologies. Besides, the development of shale gas & tight oil, mounting offshore oil & gas production, and the growing replacement & upgradation of aging drilling equipment are also expected to boost the market in the forecast years.
As new reserves are being discovered and existing wells are undergoing maintenance & drilling, the demand for draw works equipment is increasing at a significant pace to cater to the mounting oil & gas exploration activities worldwide. In addition, with the depletion of easily accessible onshore & shallow-water reserves, exploration activities in deepwater & ultra-deepwater areas are also expanding, which require specialized draw works equipment that can handle the unique demands of deepwater drilling under challenging environments.
| Report Coverage | Details |
|---|---|
| Study Period | Historical Data: 2018-21 |
| Base Year: 2022 | |
| Forecast Period: 2023-28 | |
| Regions Covered | North America: USA, Canada, Mexico |
| Europe: Germany, The UK, France, Italy, Spain, Rest of Europe | |
| Asia-Pacific: China, Japan, Australia, India, South Korea, Rest of Asia Pacific | |
| South America: Brazil, Argentina, Rest of South America | |
| Middle East & Africa: South Africa, The UAE, Saudi Arabia, Rest of the Middle East and Africa | |
| Key Companies Profiled | National Oilwell Varco Inc., Schlumberger Limited DrawWorks, L.P., Loadmaster Universal Rigs, Inc, Drillmec India Pvt Ltd Alta Rig Systems Inc., Tri-Service Oilfield Manufacturing Ltd., Century Geophysical, L.L.C, Canrig Drilling Technology Ltd, Hannon Hydraulics BHL International Inc., Warrior Manufacturing Services Ltd., Drillmec Inc., Loadmaster Universal Rigs, Inc., Bronco Manufacturing LLC |
| Unit Denominations | USD Million/Billion |
Moreover, the advent of modern drilling technologies like rig automation, advanced control systems, and improved safety features, coupled with enhanced drilling efficiencies & increased safety standards, and a rise in offshore production activities, including subsea drilling & floating production systems, are also stimulating the growth of the draw works industry.
Furthermore, ever-increased energy requirements, particularly in Asia-Pacific & Latin America, due to rapid industrialization and economic growth, coupled with the growing emphasis on safety & environmental sustainability, i.e., fueling the adoption of advanced draw works equipment that meets stringent safety standards & reduces environmental impact, are other prominent aspects anticipated to spur growth in the Draw Works Market through 2028
- Market Segmentation
- Introduction
- Product Definition
- Research Process
- Assumptions
- Executive Summary
- Global Draw Works Market Regulations and Policy
- Global Draw Works Market Trends & Developments
- Global Draw Works Market Supply Chain Analysis
- Global Draw Works Market Dynamics
- Drivers
- Challenges
- Global Draw Works Market Hotspots & Opportunities
- Global Draw Works Market Outlook, 2018-2028F
- Market Size & Analysis
- By Revenues (USD Million)
- Market Share & Analysis
- By Component
- Drum - Market Size & Forecast 2018-2028, (USD Million)
- Power Source- Market Size & Forecast 2018-2028, (USD Million)
- Reduction Gear - Market Size & Forecast 2018-2028, (USD Million)
- Brake - Market Size & Forecast 2018-2028, (USD Million)
- Auxiliary Brake - Market Size & Forecast 2018-2028, (USD Million)
- Others - Market Size & Forecast 2018-2028, (USD Million)
- By Power Source
- AC - Market Size & Forecast 2018-2028, (USD Million)
- DC- Market Size & Forecast 2018-2028, (USD Million)
- By Application
- Offshore - Market Size & Forecast 2018-2028, (USD Million)
- Onshore- Market Size & Forecast 2018-2028, (USD Million)
- By Speed
- Single Speed Gear Driven- Market Size & Forecast 2018-2028, (USD Million)
- Dual Speed Gear Driven - Market Size & Forecast 2018-2028, (USD Million)
- By Region
- North America
- South America
- Europe
- Asia-Pacific
- The Middle East and Africa
- By Company
- Market Share
- Competition Characteristics
- By Component
- Market Size & Analysis
- North America Draw Works Market Outlook, 2018-2028F
- Market Size & Analysis
- By Revenues (USD Million)
- Market Share & Analysis
- By Component- Market Size & Forecast 2018-2028, (USD Million)
- By Power Source- Market Size & Forecast 2018-2028, (USD Million)
- By Application- Market Size & Forecast 2018-2028, (USD Million)
- By Speed- Market Size & Forecast 2018-2028, (USD Million)
- By Country
- The US
- Canada
- Mexico
- The US Draw Works Market Outlook, 2018-2028F
- Market Size & Analysis
- By Revenues (USD Million)
- Market Share & Analysis
- By Component- Market Size & Forecast 2018-2028, (USD Million)
- By Power Source- Market Size & Forecast 2018-2028, (USD Million)
- By Application- Market Size & Forecast 2018-2028, (USD Million)
- By Speed- Market Size & Forecast 2018-2028, (USD Million)
- Market Size & Analysis
- Canada Draw Works Market Outlook, 2018-2028F
- Market Size & Analysis
- By Revenues (USD Million)
- Market Share & Analysis
- By Component - Market Size & Forecast 2018-2028, (USD Million)
- By Power Source- Market Size & Forecast 2018-2028, (USD Million)
- By Application- Market Size & Forecast 2018-2028, (USD Million)
- By Speed- Market Size & Forecast 2018-2028, (USD Million)
- Market Size & Analysis
- Mexico Draw Works Market Outlook, 2018-2028F
- Market Size & Analysis
- By Revenues (USD Million)
- Market Share & Analysis
- By Component - Market Size & Forecast 2018-2028, (USD Million)
- By Power Source- Market Size & Forecast 2018-2028, (USD Million)
- By Application- Market Size & Forecast 2018-2028, (USD Million)
- By Speed- Market Size & Forecast 2018-2028, (USD Million)
- Market Size & Analysis
- Market Size & Analysis
- South America Draw Works Market Outlook, 2018-2028F
- Market Size & Analysis
- By Revenues (USD Million)
- Market Share & Analysis
- By Component- Market Size & Forecast 2018-2028, (USD Million)
- By Power Source- Market Size & Forecast 2018-2028, (USD Million)
- By Application- Market Size & Forecast 2018-2028, (USD Million)
- By Speed- Market Size & Forecast 2018-2028, (USD Million)
- By Country
- Brazil
- Argentina
- Rest of South America
- Brazil Draw Works Market Outlook, 2018-2028F
- Market Size & Analysis
- By Revenues (USD Million)
- Market Share & Analysis
- By Component - Market Size & Forecast 2018-2028, (USD Million)
- By Power Source- Market Size & Forecast 2018-2028, (USD Million)
- By Application- Market Size & Forecast 2018-2028, (USD Million)
- By Speed- Market Size & Forecast 2018-2028, (USD Million)
- Market Size & Analysis
- Argentina Draw Works Market Outlook, 2018-2028F
- Market Size & Analysis
- By Revenues (USD Million)
- Market Share & Analysis
- By Component - Market Size & Forecast 2018-2028, (USD Million)
- By Power Source- Market Size & Forecast 2018-2028, (USD Million)
- By Application- Market Size & Forecast 2018-2028, (USD Million)
- By Speed- Market Size & Forecast 2018-2028, (USD Million)
- Market Size & Analysis
- Market Size & Analysis
- Europe Draw Works Market Outlook, 2018-2028F
- Market Size & Analysis
- By Revenues (USD Million)
- Market Share & Analysis
- By Component - Market Size & Forecast 2018-2028, (USD Million)
- By Power Source- Market Size & Forecast 2018-2028, (USD Million)
- By Application- Market Size & Forecast 2018-2028, (USD Million)
- By Speed- Market Size & Forecast 2018-2028, (USD Million)
- By Country
- Germany
- The UK
- France
- Italy
- Spain
- Rest of Europe
- Germany Draw Works Market Outlook, 2018-2028F
- Market Size & Analysis
- By Revenues (USD Million)
- Market Share & Analysis
- By Component- Market Size & Forecast 2018-2028, (USD Million)
- By Power Source- Market Size & Forecast 2018-2028, (USD Million)
- By Application- Market Size & Forecast 2018-2028, (USD Million)
- By Speed- Market Size & Forecast 2018-2028, (USD Million)
- Market Size & Analysis
- The UK Draw Works Market Outlook, 2018-2028F
- Market Size & Analysis
- By Revenues (USD Million)
- Market Share & Analysis
- By Component - Market Size & Forecast 2018-2028, (USD Million)
- By Power Source- Market Size & Forecast 2018-2028, (USD Million)
- By Application- Market Size & Forecast 2018-2028, (USD Million)
- By Speed- Market Size & Forecast 2018-2028, (USD Million)
- Market Size & Analysis
- France Draw Works Market Outlook, 2018-2028F
- Market Size & Analysis
- By Revenues (USD Million)
- Market Share & Analysis
- By Component - Market Size & Forecast 2018-2028, (USD Million)
- By Power Source- Market Size & Forecast 2018-2028, (USD Million)
- By Application- Market Size & Forecast 2018-2028, (USD Million)
- By Speed- Market Size & Forecast 2018-2028, (USD Million)
- Market Size & Analysis
- Italy Draw Works Market Outlook, 2018-2028F
- Market Size & Analysis
- By Revenues (USD Million)
- Market Share & Analysis
- By Component - Market Size & Forecast 2018-2028, (USD Million)
- By Power Source- Market Size & Forecast 2018-2028, (USD Million)
- By Application- Market Size & Forecast 2018-2028, (USD Million)
- By Speed- Market Size & Forecast 2018-2028, (USD Million)
- Market Size & Analysis
- Spain Draw Works Market Outlook, 2018-2028F
- Market Size & Analysis
- By Revenues (USD Million)
- Market Share & Analysis
- By Component - Market Size & Forecast 2018-2028, (USD Million)
- By Power Source- Market Size & Forecast 2018-2028, (USD Million)
- By Application- Market Size & Forecast 2018-2028, (USD Million)
- By Speed- Market Size & Forecast 2018-2028, (USD Million)
- Market Size & Analysis
- Market Size & Analysis
- Asia-Pacific Draw Works Market Outlook, 2018-2028F
- Market Size & Analysis
- By Revenues (USD Million)
- Market Share & Analysis
- By Component - Market Size & Forecast 2018-2028, (USD Million)
- By Power Source- Market Size & Forecast 2018-2028, (USD Million)
- By Application- Market Size & Forecast 2018-2028, (USD Million)
- By Speed- Market Size & Forecast 2018-2028, (USD Million)
- By Country
- China
- Japan
- Australia
- India
- South Korea
- Rest of Asia Pacific
- Market Size & Analysis
- China Draw Works Market Outlook, 2018-2028F
- Market Size & Analysis
- By Revenues (USD Million)
- Market Share & Analysis
- By Component - Market Size & Forecast 2018-2028, (USD Million)
- By Power Source- Market Size & Forecast 2018-2028, (USD Million)
- By Application- Market Size & Forecast 2018-2028, (USD Million)
- By Speed- Market Size & Forecast 2018-2028, (USD Million)
- Market Size & Analysis
- Japan Draw Works Market Outlook, 2018-2028F
- Market Size & Analysis
- By Revenues (USD Million)
- Market Share & Analysis
- By Component- Market Size & Forecast 2018-2028, (USD Million)
- By Power Source- Market Size & Forecast 2018-2028, (USD Million)
- By Application- Market Size & Forecast 2018-2028, (USD Million)
- By Speed- Market Size & Forecast 2018-2028, (USD Million)
- Market Size & Analysis
- Australia Draw Works Market Outlook, 2018-2028F
- Market Size & Analysis
- By Revenues (USD Million)
- Market Share & Analysis
- By Component- Market Size & Forecast 2018-2028, (USD Million)
- By Power Source- Market Size & Forecast 2018-2028, (USD Million)
- By Application- Market Size & Forecast 2018-2028, (USD Million)
- By Speed- Market Size & Forecast 2018-2028, (USD Million)
- Market Size & Analysis
- India Draw Works Market Outlook, 2018-2028F
- Market Size & Analysis
- By Revenues (USD Million)
- Market Share & Analysis
- By Component- Market Size & Forecast 2018-2028, (USD Million)
- By Power Source- Market Size & Forecast 2018-2028, (USD Million)
- By Application- Market Size & Forecast 2018-2028, (USD Million)
- By Speed- Market Size & Forecast 2018-2028, (USD Million)
- Market Size & Analysis
- South Korea Draw Works Market Outlook, 2018-2028F
- Market Size & Analysis
- By Revenues (USD Million)
- Market Share & Analysis
- By Component- Market Size & Forecast 2018-2028, (USD Million)
- By Power Source- Market Size & Forecast 2018-2028, (USD Million)
- By Application- Market Size & Forecast 2018-2028, (USD Million)
- By Speed- Market Size & Forecast 2018-2028, (USD Million)
- Market Size & Analysis
- The Middle East and Africa Draw Works Market Outlook, 2018-2028F
- Market Size & Analysis
- By Revenues (USD Million)
- Market Share & Analysis
- By Component- Market Size & Forecast 2018-2028, (USD Million)
- By Power Source- Market Size & Forecast 2018-2028, (USD Million)
- By Application- Market Size & Forecast 2018-2028, (USD Million)
- By Speed- Market Size & Forecast 2018-2028, (USD Million)
- By Country
- South Africa
- The UAE
- Saudi Arabia
- Rest of the Middle East and Africa
- Market Size & Analysis
- South Africa Draw Works Market Outlook, 2018-2028F
- Market Size & Analysis
- By Revenues (USD Million)
- Market Share & Analysis
- By Component- Market Size & Forecast 2018-2028, (USD Million)
- By Power Source- Market Size & Forecast 2018-2028, USD Million
- By Application- Market Size & Forecast 2018-2028, (USD Million)
- By Speed- Market Size & Forecast 2018-2028, (USD Million)
- Market Size & Analysis
- The UAE Draw Works Market Outlook, 2018-2028F
- Market Size & Analysis
- By Revenues (USD Million)
- Market Share & Analysis
- By Component- Market Size & Forecast 2018-2028, (USD Million)
- By Power Source- Market Size & Forecast 2018-2028, (USD Million)
- By Application- Market Size & Forecast 2018-2028, (USD Million)
- By Speed- Market Size & Forecast 2018-2028, (USD Million)
- Market Size & Analysis
- Saudi Arabia Draw Works Market Outlook, 2018-2028F
- Market Size & Analysis
- By Revenues (USD Million)
- Market Share & Analysis
- By Component- Market Size & Forecast 2018-2028, (USD Million)
- By Power Source- Market Size & Forecast 2018-2028, (USD Million)
- By Application- Market Size & Forecast 2018-2028, (USD Million)
- By Speed- Market Size & Forecast 2018-2028, (USD Million)
- Market Size & Analysis
- Competitive Outlook
- Company Profiles
- National Oilwell Varco Inc.
- Business Description
- Component Portfolio
- Strategic Alliances or Partnerships
- Recent Developments
- Financial Details
- Others
- Schlumberger Limited
- Business Description
- Component Portfolio
- Strategic Alliances or Partnerships
- Recent Developments
- Financial Details
- Others
- DrawWorks, L.P.
- Business Description
- Component Portfolio
- Strategic Alliances or Partnerships
- Recent Developments
- Financial Details
- Others
- Loadmaster Universal Rigs, Inc
- Business Description
- Component Portfolio
- Strategic Alliances or Partnerships
- Recent Developments
- Financial Details
- Others
- Drillmec India Pvt Ltd
- Business Description
- Component Portfolio
- Strategic Alliances or Partnerships
- Recent Developments
- Financial Details
- Others
- Alta Rig Systems Inc.
- Business Description
- Component Portfolio
- Strategic Alliances or Partnerships
- Recent Developments
- Financial Details
- Others
- Tri-Service Oilfield Manufacturing Ltd.
- Business Description
- Component Portfolio
- Strategic Alliances or Partnerships
- Recent Developments
- Financial Details
- Others
- Century Geophysical, L.L.C
- Business Description
- Component Portfolio
- Strategic Alliances or Partnerships
- Recent Developments
- Financial Details
- Others
- Canrig Drilling Technology Ltd
- Business Description
- Component Portfolio
- Strategic Alliances or Partnerships
- Recent Developments
- Financial Details
- Others
- Hannon Hydraulics
- Business Description
- Component Portfolio
- Strategic Alliances or Partnerships
- Recent Developments
- Financial Details
- Others
- BHL International Inc.
- Business Description
- Component Portfolio
- Strategic Alliances or Partnerships
- Recent Developments
- Financial Details
- Others
- Warrior Manufacturing Services Ltd.
- Business Description
- Component Portfolio
- Strategic Alliances or Partnerships
- Recent Developments
- Financial Details
- Others
- Drillmec Inc.
- Business Description
- Component Portfolio
- Strategic Alliances or Partnerships
- Recent Developments
- Financial Details
- Others
- Loadmaster Universal Rigs, Inc.
- Business Description
- Component Portfolio
- Strategic Alliances or Partnerships
- Recent Developments
- Financial Details
- Others
- Bronco Manufacturing LLC
- Business Description
- Component Portfolio
- Strategic Alliances or Partnerships
- Recent Developments
- Financial Details
- Others
- National Oilwell Varco Inc.
- Company Profiles
- Disclaimer
MarkNtel Advisors follows a robust and iterative research methodology designed to ensure maximum accuracy and minimize deviation in market estimates and forecasts. Our approach combines both bottom-up and top-down techniques to effectively segment and quantify various aspects of the market. A consistent feature across all our research reports is data triangulation, which examines the market from three distinct perspectives to validate findings. Key components of our research process include:
1. Scope & Research Design At the outset, MarkNtel Advisors define the research objectives and formulate pertinent questions. This phase involves determining the type of research—qualitative or quantitative—and designing a methodology that outlines data collection methods, target demographics, and analytical tools. They also establish timelines and budgets to ensure the research aligns with client goals.
2. Sample Selection and Data Collection In this stage, the firm identifies the target audience and determines the appropriate sample size to ensure representativeness. They employ various sampling methods, such as random or stratified sampling, based on the research objectives. Data collection is carried out using tools like surveys, interviews, and observations, ensuring the gathered data is reliable and relevant.
3. Data Analysis and Validation Once data is collected, MarkNtel Advisors undertake a rigorous analysis process. This includes cleaning the data to remove inconsistencies, employing statistical software for quantitative analysis, and thematic analysis for qualitative data. Validation steps are taken to ensure the accuracy and reliability of the findings, minimizing biases and errors.

4. Data Forecast and FinalizationThe final phase involves forecasting future market trends based on the analyzed data. MarkNtel Advisors utilize predictive modeling and time series analysis to anticipate market behaviors. The insights are then compiled into comprehensive reports, featuring visual aids like charts and graphs, and include strategic recommendations to inform client decision-making
We offer flexible licensing options to cater to varying organizational needs. Choose the pricing pack that best suits your requirements:
Buy Now