

By Offering (Hardware (Instruments, Sensors & Probes, Reagents, Kits & Consumables), Software (Monitoring Software, Data Management & Analytics Platforms, Cloud & Remote Monitoring Platforms), Service... ... Platforms), Services (Installation & Commissioning, Calibration & Maintenance, Technical Support, Consulting & Training)), By Monitoring Technology (Online/Continuous Monitoring Systems, Portable/Field Monitoring Systems, Laboratory-Based Monitoring Systems, Remote/Telemetry-Based Monitoring Systems), By Parameter Type (Physical Parameters, Chemical Parameters, Biological Parameters), By Application (Drinking Water Monitoring, Wastewater Monitoring, Surface Water Monitoring, Groundwater Monitoring, Industrial Process Water Monitoring, Aquaculture & Agriculture Monitoring, Environmental Monitoring), By End User (Municipal Utilities, Industrial Sector, Environmental Agencies & Research Institutions, Commercial Sector) Read more
- Environment
- Aug 2026
- 160
- PDF, Excel, PPT
US Water Quality Monitoring Market Key Takeaways
- The US water quality monitoring market was valued at USD 1.84 billion in 2025 and is projected to grow from USD 1.95 billion in 2026 to USD 2.79 billion by 2032.
- The industry is projected to witness steady growth at a CAGR of 6.2% during 2026–2032.
- Hardware remains the dominant offering segment, accounting for an estimated 62.8% market share in 2026.
- Online/continuous monitoring systems lead the market by monitoring technology, capturing an estimated 41.5% share in 2026.
- The industry is moderately consolidated, with the top 10 companies collectively accounting for an estimated 60% market share in 2026.
US Water Quality Monitoring Market Size and Outlook
The water quality monitoring market in the United States stands at USD 1.84 billion in 2025, reaches USD 1.95 billion in 2026, and is projected to attain USD 2.79 billion by 2032, expanding at a 6.2% CAGR during 2026–2032.
Structural growth is reinforced by the EPA’s PFAS National Primary Drinking Water Regulation. Public water systems must complete initial monitoring for covered PFAS by 2027 and subsequently conduct ongoing compliance monitoring, creating sustained demand for sampling equipment, laboratory analyzers, data-management systems, and related calibration services.
The addressable installed base is extensive. According to the Environmental Protection Agency(EPA), the United States has more than 148,000 public water systems, which collectively supply drinking water to approximately 90% of the population. This distributed utility structure supports recurring expenditure on water quality analyzers, portable meters, online instruments, reagents, replacement sensors, and maintenance contracts.
Federal infrastructure spending also supports modernization. The EPA states that the Infrastructure Investment and Jobs Act provides more than USD 50 billion for drinking water, wastewater, reuse, conveyance, and water-storage infrastructure, including more than USD 35 billion in dedicated safe-drinking-water funding. This capital cycle accelerates the adoption of digital monitoring and compliance-ready instrumentation.
US Water Quality Monitoring Market Key Indicators
- According to the U.S. Environmental Protection Agency (EPA), the United States operates more than 148,000 public water systems, supplying drinking water to nearly 90% of the U.S. population. Continuous compliance monitoring across these systems requires frequent testing of physical, chemical, and biological parameters, directly driving demand for online sensors, laboratory analyzers, and water quality monitoring solutions.
- The U.S. wastewater sector treats approximately 34 billion gallons of wastewater every day through more than 16,000 publicly owned treatment works (POTWs). Continuous monitoring of parameters such as pH, dissolved oxygen, turbidity, biochemical oxygen demand (BOD), chemical oxygen demand (COD), ammonia, and nutrient concentrations is mandatory for treatment optimization and regulatory compliance, thereby supporting sustained demand for water quality monitoring equipment.
- According to the U.S. Geological Survey (USGS), the United States maintains over 13,000 real-time surface water monitoring stations across rivers, lakes, reservoirs, and streams. The continuous collection of water quality and hydrological data requires advanced monitoring instruments, telemetry systems, and automated sensors, positively influencing the growth of the water quality monitoring market.
- According to the National Oceanic and Atmospheric Administration (NOAA), the United States has more than 95,000 miles (153,000 km) of coastline and extensive estuarine ecosystems under continuous environmental surveillance. Monitoring coastal water quality for nutrients, dissolved oxygen, harmful algal blooms, salinity, and microbial contamination is expanding the deployment of advanced marine water quality monitoring systems, thereby contributing to the growth of the United States water quality monitoring industry.
US Water Quality Monitoring Market Scope
| Category | Segments |
|---|---|
| By Offering | Hardware (Instruments, Sensors & Probes, Reagents, Kits & Consumables), Software (Monitoring Software, Data Management & Analytics Platforms, Cloud & Remote Monitoring Platforms), Services (Installation & Commissioning, Calibration & Maintenance, Technical Support, Consulting & Training |
| By Monitoring Technology | Online/Continuous Monitoring Systems, Portable/Field Monitoring Systems, Laboratory-Based Monitoring Systems, Remote/Telemetry-Based Monitoring Systems |
| By Parameter Type | Physical Parameters, Chemical Parameters, Biological Parameters |
| By Application | Drinking Water Monitoring, Wastewater Monitoring, Surface Water Monitoring, Groundwater Monitoring, Industrial Process Water Monitoring, Aquaculture & Agriculture Monitoring, Environmental Monitoring |
| By End User | Municipal Utilities, Industrial Sector, Environmental Agencies & Research Institutions, Commercial Sector |
US Water Quality Monitoring Market Growth Drivers
Stringent Regulatory Frameworks and Growing Water Safety Concerns
Stringent federal water quality regulations continue to accelerate demand for advanced water quality monitoring systems across the United States. The U.S. Environmental Protection Agency (EPA) finalized the National Primary Drinking Water Regulations (NPDWR) for PFAS in 2024, establishing enforceable limits for six PFAS compounds and requiring public water systems to complete initial monitoring by 2027 alongside ongoing compliance monitoring thereafter. These evolving regulatory requirements are encouraging utilities and industrial facilities to invest in continuous monitoring technologies that improve compliance, operational efficiency, and reporting accuracy.
Growing concerns over drinking water safety and emerging contaminants further strengthen market expansion. According to the U.S. EPA's 7th Drinking Water Infrastructure Needs Survey and Assessment, nearly USD 625 billion is required over the next 20 years to maintain and modernize the nation's drinking water infrastructure. Increasing contamination risks from PFAS, heavy metals, and aging distribution networks are prompting utilities to deploy real-time monitoring systems that enable early contaminant detection, enhance water safety, and support long-term infrastructure resilience.
Recent Trends
Rising Deployment of Smart and Connected Water Quality Monitoring Solutions
The increasing adoption of smart and IoT-enabled water quality monitoring systems is reshaping water management across municipal, industrial, and environmental applications in the United States. According to the U.S. Geological Survey (USGS), the National Water Dashboard integrates real-time hydrologic information from more than 13,500 monitoring stations nationwide, providing continuous data on streamflow, groundwater, water quality, and weather conditions. The expanding deployment of connected monitoring networks is accelerating demand for cloud-based analytics, remote diagnostics, and predictive asset management solutions.
The industry is also witnessing growing investments in digital water platforms to strengthen real-time operational intelligence. In December 2024, Xylem acquired a majority stake in Idrica, integrating the company's water data management and analytics platform with Xylem Vue to provide utilities with real-time visibility into water quality, pressure, and consumption data. This development reflects the industry's transition toward Industrial IoT (IIoT)-enabled monitoring, enabling utilities to optimize asset performance, improve operational efficiency, and support data-driven water management.
US Water Quality Monitoring Market Opportunities and Challenges
Stringent PFAS Monitoring Requirements Create Opportunities for Continuous Water Quality Monitoring Systems
The implementation of stringent PFAS monitoring regulations presents a major challenge for water utilities across the United States. The U.S. Environmental Protection Agency (EPA) finalized the National Primary Drinking Water Regulation (NPDWR) for PFAS in 2024, establishing enforceable Maximum Contaminant Levels (MCLs) of 4 parts per trillion (ppt) for PFOA and PFOS while requiring ongoing monitoring and compliance reporting. These stringent requirements are placing increasing pressure on utilities to strengthen monitoring infrastructure, improve data accuracy, and deploy continuous water quality monitoring systems capable of supporting regulatory compliance.
The same regulatory requirements are creating significant opportunities for smart monitoring infrastructure and real-time water quality management. In 2025, the Arizona Department of Environmental Quality (ADEQ) allocated approximately USD 5 million to expand PFAS monitoring, install new monitoring infrastructure, and upgrade water sampling systems across the state. Growing investments in connected sensors, remote monitoring platforms, and digital water management technologies are enabling utilities to detect contaminants earlier, enhance operational efficiency, and strengthen regulatory compliance, driving sustained demand for advanced water quality monitoring solutions.
Segmentation Insights
Capital-Intensive Equipment Deployment Sustains Hardware Market Leadership
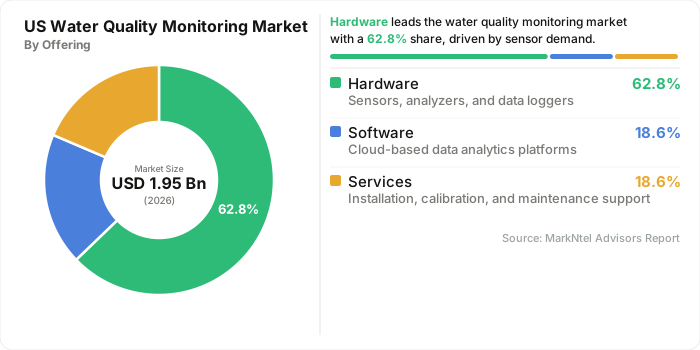
The hardware segment is estimated to account for 62.8% of the US water quality monitoring market in 2026, making it the largest revenue-generating offering. Its dominance is driven by the indispensable role of sensors, analyzers, transmitters, controllers, and multiparameter monitoring instruments across municipal water utilities, industrial facilities, and environmental monitoring networks. As monitoring hardware forms the foundation of every water quality monitoring system, utilities continue to invest in equipment replacement, network expansion, and technology upgrades to ensure accurate, real-time measurements and regulatory compliance, sustaining the segment's market leadership.
Growing federal investments in addressing emerging contaminants are expected to unlock substantial business opportunities for hardware manufacturers. Under the Infrastructure Investment and Jobs Act (IIJA), the U.S. Environmental Protection Agency (EPA) is administering USD 10 billion to address emerging contaminants such as PFAS, including USD 5 billion through the Safe Drinking Water Act Assistance for Small and Disadvantaged Communities Grant Program, USD 4 billion through the Drinking Water State Revolving Fund, and USD 1 billion through the Clean Water State Revolving Fund. These investments are accelerating the deployment of advanced monitoring equipment and strengthening long-term demand for next-generation water quality monitoring hardware across the United States. Based on offering type, the industry is segmented into:
- Hardware
- Software
- Services
Continuous Regulatory Compliance Drives Adoption of Online and Real-Time Water Quality Monitoring Systems
The online/continuous monitoring systems segment dominated the US water quality monitoring market, accounting for 41.5% of the industry in 2026, making it the largest revenue-generating monitoring technology. Its dominance is driven by the extensive installed base that requires uninterrupted water-quality surveillance across municipal utilities, industrial facilities, and environmental monitoring networks. According to the U.S. Environmental Protection Agency's (EPA) Safe Drinking Water Information System (SDWIS), nearly 50,000 community water systems serve approximately 300 million people nationwide, creating sustained demand for online sensors, transmitters, and SCADA-integrated analyzers capable of delivering continuous, regulatory-compliant water quality monitoring.
Continuous innovation in online analytical instrumentation is further strengthening the segment's commercial outlook. In September 2025, Hach introduced the EZ sc Series of online analyzers, an upgraded platform designed to provide continuous monitoring of critical water quality parameters across municipal and industrial treatment facilities. The launch reflects the growing replacement of legacy monitoring infrastructure with intelligent, connected analytical systems, creating long-term business opportunities for manufacturers through recurring revenues from instrumentation upgrades, calibration services, consumables, and integrated digital monitoring platforms. Based on monitoring technology, the industry is segmented into:
- Online/Continuous Monitoring Systems
- Portable/Field Monitoring Systems
- Laboratory-Based Monitoring Systems
- Remote/Telemetry-Based Monitoring Systems
US Water Quality Monitoring Market Competitive Analysis
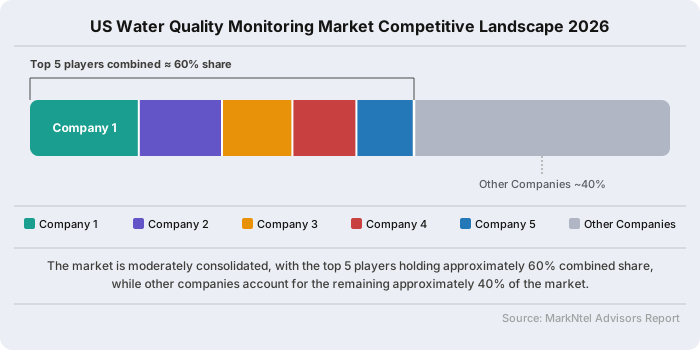
The market is moderately fragmented, with the five largest corporate groups accounting for 60% of US revenue in 2026. Leadership depends on installed-base scale, proprietary sensing and analytical technologies, portfolio breadth, regulatory-method support, national service coverage, software integration, consumables revenue, and relationships with municipal utilities, environmental agencies, industrial plants, and commercial laboratories.
Top Companies in the US Water Quality Monitoring Market
- Danaher Corporation
- Xylem Inc.
- Thermo Fisher Scientific Inc.
- Agilent Technologies, Inc.
- Teledyne Technologies Incorporated
- HORIBA, Ltd.
- Shimadzu Corporation
- Waters Corporation
- Metrohm AG
- Endress+Hauser Group Services AG
US Water Quality Monitoring Industry News and Recent Developments
July 2026: Xylem to Acquire WaterFleet for Approximately USD 200 Million
Xylem Inc. signed a definitive agreement in July 2026 to acquire WaterFleet, LLC, a San Antonio-based provider of mobile water and wastewater treatment services, from investment funds managed by EagleTree Capital for approximately USD 200 million. WaterFleet's offerings include mobile potable water production and storage, domestic wastewater treatment, and water quality monitoring for remote, temporary, and infrastructure-critical sites. The transaction will be folded into Xylem's Water Solutions and Services segment and is expected to close later in 2026, subject to customary regulatory approvals.
Impact Analysis: The acquisition extends Xylem's monitoring and treatment reach into remote and infrastructure-constrained sites that fall outside conventional fixed-plant monitoring networks. It signals continued consolidation among established instrumentation and water-technology vendors seeking to broaden service-based, recurring-revenue offerings alongside core hardware sales, intensifying competition for mobile and field-deployable water quality monitoring contracts.
January 2026: Teledyne Technologies Acquires UK-Based DD-Scientific
Teledyne Technologies announced in January 2026 the acquisition of DD-Scientific Holdings Limited, a Fareham, UK-based manufacturer of high-performance electrochemical gas sensors used in industrial safety, healthcare, and environmental and emissions monitoring applications. DD-Scientific will operate as a separate business unit within Teledyne's Instrumentation segment. Financial terms of the transaction were not disclosed.
Impact Analysis: The acquisition strengthens Teledyne's broader environmental and process instrumentation portfolio, complementing its existing water and gas monitoring product lines with additional sensing technology. It reflects continued strategic M&A activity among established instrumentation manufacturers seeking to deepen sensor technology across adjacent environmental monitoring categories relevant to industrial and municipal customers.
- Market Segmentation
- Introduction
- Product Definition
- Research Process
- Assumptions
- Executive Summary
- US Water Quality Monitoring Market Policies, Regulations, and Product Standards
- US Water Quality Monitoring Market Trends & Developments
- US Water Quality Monitoring Market Dynamics
- Growth Factors
- Challenges
- US Water Quality Monitoring Market Hotspot & Opportunities
- US Water Quality Monitoring Market Outlook, 2022-2032
- Market Size & Outlook
- By Revenues (USD Million)
- Market Share & Analysis
- By Offering- Market Size & Forecast 2022-2032, USD Million
- Hardware
- Instruments
- Sensors & Probes
- Reagents, Kits & Consumables
- Software
- Monitoring Software
- Data Management & Analytics Platforms
- Cloud & Remote Monitoring Platforms
- Services
- Installation & Commissioning
- Calibration & Maintenance
- Technical Support
- Consulting & Training
- Hardware
- By Monitoring Technology- Market Size & Forecast 2022-2032, USD Million
- Online/Continuous Monitoring Systems
- Portable/Field Monitoring Systems
- Laboratory-Based Monitoring Systems
- Remote/Telemetry-Based Monitoring Systems
- By Parameter Type- Market Size & Forecast 2022-2032, USD Million
- Physical Parameters
- Chemical Parameters
- Biological Parameters
- By Application- Market Size & Forecast 2022-2032, USD Million
- Drinking Water Monitoring
- Wastewater Monitoring
- Surface Water Monitoring
- Groundwater Monitoring
- Industrial Process Water Monitoring
- Aquaculture & Agriculture Monitoring
- Environmental Monitoring
- By End User- Market Size & Forecast 2022-2032, USD Million
- Municipal Utilities
- Industrial Sector
- Environmental Agencies & Research Institutions
- Commercial Sector
- By Company
- Competition Characteristics
- Market Share & Analysis
- By Offering- Market Size & Forecast 2022-2032, USD Million
- Market Size & Outlook
- US Drinking Water Quality Monitoring Market Outlook, 2022-2032
- Market Size & Outlook
- By Revenues (USD Million)
- Market Segmentation & Analysis
- By Monitoring Technology- Market Size & Forecast 2022-2032, USD Million
- By Parameter Type- Market Size & Forecast 2022-2032, USD Million
- By Application- Market Size & Forecast 2022-2032, USD Million
- By End User- Market Size & Forecast 2022-2032, USD Million
- Market Size & Outlook
- US Waste Water Quality Monitoring Market Outlook, 2022-2032
- Market Size & Outlook
- By Revenues (USD Million)
- Market Segmentation & Analysis
- By Monitoring Technology- Market Size & Forecast 2022-2032, USD Million
- By Parameter Type- Market Size & Forecast 2022-2032, USD Million
- By Application- Market Size & Forecast 2022-2032, USD Million
- By End User- Market Size & Forecast 2022-2032, USD Million
- Market Size & Outlook
- US Surface & Groundwater Quality Monitoring Systems Market Outlook, 2022-2032
- Market Size & Outlook
- By Revenues (USD Million)
- Market Segmentation & Analysis
- By Monitoring Technology- Market Size & Forecast 2022-2032, USD Million
- By Parameter Type- Market Size & Forecast 2022-2032, USD Million
- By Application- Market Size & Forecast 2022-2032, USD Million
- By End User- Market Size & Forecast 2022-2032, USD Million
- Market Size & Outlook
- US Industrial & Environmental Water Quality Monitoring Systems Market Outlook, 2022-2032
- Market Size & Outlook
- By Revenues (USD Million)
- Market Segmentation & Analysis
- By Monitoring Technology- Market Size & Forecast 2022-2032, USD Million
- By Parameter Type- Market Size & Forecast 2022-2032, USD Million
- By Application- Market Size & Forecast 2022-2032, USD Million
- By End User- Market Size & Forecast 2022-2032, USD Million
- Market Size & Outlook
- US Water Quality Monitoring Market Key Strategic Imperatives for Success & Growth
- Competitive Outlook
- Company Profiles
- Danaher Corporation
- Business Description
- Product Portfolio
- Collaborations & Alliances
- Recent Developments
- Financial Details
- Others
- Xylem Inc.
- Business Description
- Product Portfolio
- Collaborations & Alliances
- Recent Developments
- Financial Details
- Others
- Thermo Fisher Scientific Inc.
- Business Description
- Product Portfolio
- Collaborations & Alliances
- Recent Developments
- Financial Details
- Others
- Agilent Technologies, Inc.
- Business Description
- Product Portfolio
- Collaborations & Alliances
- Recent Developments
- Financial Details
- Others
- Teledyne Technologies Incorporated
- Business Description
- Product Portfolio
- Collaborations & Alliances
- Recent Developments
- Financial Details
- Others
- HORIBA, Ltd.
- Business Description
- Product Portfolio
- Collaborations & Alliances
- Recent Developments
- Financial Details
- Others
- Shimadzu Corporation
- Business Description
- Product Portfolio
- Collaborations & Alliances
- Recent Developments
- Financial Details
- Others
- Waters Corporation
- Business Description
- Product Portfolio
- Collaborations & Alliances
- Recent Developments
- Financial Details
- Others
- Metrohm AG
- Business Description
- Product Portfolio
- Collaborations & Alliances
- Recent Developments
- Financial Details
- Others
- Endress+Hauser Group Services AG
- Business Description
- Product Portfolio
- Collaborations & Alliances
- Recent Developments
- Financial Details
- Others
- Danaher Corporation
- Company Profiles
- Disclaimer

MarkNtel Advisors follows a robust and iterative research methodology designed to ensure maximum accuracy and minimize deviation in market estimates and forecasts. Our approach combines both bottom-up and top-down techniques to effectively segment and quantify various aspects of the market. A consistent feature across all our research reports is data triangulation, which examines the market from three distinct perspectives to validate findings. Key components of our research process include:
1. Scope & Research Design At the outset, MarkNtel Advisors define the research objectives and formulate pertinent questions. This phase involves determining the type of research—qualitative or quantitative—and designing a methodology that outlines data collection methods, target demographics, and analytical tools. They also establish timelines and budgets to ensure the research aligns with client goals.
2. Sample Selection and Data Collection In this stage, the firm identifies the target audience and determines the appropriate sample size to ensure representativeness. They employ various sampling methods, such as random or stratified sampling, based on the research objectives. Data collection is carried out using tools like surveys, interviews, and observations, ensuring the gathered data is reliable and relevant.
3. Data Analysis and Validation Once data is collected, MarkNtel Advisors undertake a rigorous analysis process. This includes cleaning the data to remove inconsistencies, employing statistical software for quantitative analysis, and thematic analysis for qualitative data. Validation steps are taken to ensure the accuracy and reliability of the findings, minimizing biases and errors.

4. Data Forecast and FinalizationThe final phase involves forecasting future market trends based on the analyzed data. MarkNtel Advisors utilize predictive modeling and time series analysis to anticipate market behaviors. The insights are then compiled into comprehensive reports, featuring visual aids like charts and graphs, and include strategic recommendations to inform client decision-making
We’d love to understand what matters most to you.