

By Waste Type (Organic/Biodegradable Waste, Paper & Paperboard, Plastic Waste, Glass Waste, Metal Waste, Others), By Service Type (Collection & Transportation, Segregation & Sorting, Recycling, Biolog... ... g, Recycling, Biological Treatment (Composting & Bio-methanation), Disposal), By End user (Residential, Commercial, Industrial), and others Read more
- Environment
- Jul 2026
- 140
- PDF, Excel, PPT
India Municipal Solid Waste Management Market Key Takeaways
- The India Municipal Solid Waste Management Market was valued at USD 8.19 billion in 2025 and is projected to reach from USD 8.88 billion in 2026 to USD 14.27 billion by 2032.
- The industry is projected to witness steady growth at a CAGR of 8.23% during the forecast period, i.e., 2026-32.
- Collection & Transportation leads all service types with a 39.0% share in 2026.
- Organic waste dominates by operating model with a 55% share in 2026.
- North India holds the largest regional share at 30.0% in 2026.
- The market is moderately fragmented, with top five players collectively account for approximately 15% of the market, indicating significant headroom for consolidation and competitive differentiation across service verticals.
India Municipal Solid Waste Management Market Size and Outlook
The Municipal Solid Waste Management Market in India was valued at USD 8.19 billion in 2025 and is estimated to reach USD 8.88 billion in 2026. The market is further projected to grow to USD 14.27 billion by 2032, registering a CAGR of 8.23% during the forecast period (2026–2032), underpinned by accelerating urbanization, policy-backed infrastructure investment, and mounting waste generation across Tier 1 and Tier 2 cities. According to the Ministry of Housing and Urban Affairs (MoHUA), India's urban areas generate 1,66,096 tonnes per day (TPD) of municipal solid waste, of which 1,33,164 TPD is processed, representing a processing capacity of 80.17% as of 2025, up from just 16% in 2014.
The Swachh Bharat Mission 2.0, with a total outlay of USD 17.0 billion for the 2021–2026 cycle, has funded material recovery facilities, transfer stations, composting plants, construction and demolition waste plants, and waste-to-energy installations across 4,800 urban local bodies nationwide. Additionally, the 15th Finance Commission allocated USD 14.5 billion to urban local bodies over 2021–2026, with performance-linked components tied to waste segregation rates and processing capacity utilization, directly incentivizing municipal spending on collection and treatment infrastructure.
Furthermore, private sector participation has accelerated in response to these policy frameworks. Gujarat's largest waste-to-energy plant, inaugurated in Ahmedabad in 2024, processes 1,000 metric tonnes of waste daily and generates 15 megawatts of electricity, demonstrating the commercial viability of integrated waste processing models. Collectively, converging demographic pressure, policy capital, and private investment position the India municipal solid waste management industry for sustained capacity expansion through 2032.
India Municipal Solid Waste Management Market Key Indicators
- The Central Pollution Control Board (CPCB), in its 2024 Annual Report on Biomedical Waste Management, recorded 743 tonnes per day of biomedical waste generated across 4,35,257 healthcare facilities in India, of which 694 tonnes per day was treated and disposed, the remaining untreated volume, alongside the 30,91,847 hospital beds generating regulated waste, creates sustained demand for segregated collection systems, Common Biomedical Waste Treatment Facilities, and specialized disposal infrastructure distinct from general MSW streams.
- According to the Ministry of Housing and Urban Affairs (MoHUA), India generates between 150 million and 500 million tonnes of construction and demolition (C&D) waste annually as of 2024; the Environment (Construction and Demolition) Waste Management Rules, 2025, notified by the Ministry of Environment, Forest and Climate Change (MoEFCC) on April 2, 2025 and effective from April 1, 2026, mandate EPR compliance, producer registration on CPCB portals, and a 5% recycled material use target by 2026–27 rising to 25% by 2030–31, directly expanding demand for C&D waste processing plants, recycling equipment, and collection logistics.
- The Solid Waste Management Bill, 2025, introduced in the Rajya Sabha on December 5, 2025, mandates statutory source segregation for all waste-generating units and imposes direct liability on large manufacturers with capital investment exceeding USD 2.41 million to fund transportation of non-recyclable waste to notified landfills shifting financial responsibility for waste logistics from urban local bodies to industrial generators and broadening the commercial operator base for collection and transport services.
India Municipal Solid Waste Management Market Scope
| Category | Segments |
|---|---|
| By Waste Type | Organic/Biodegradable Waste, Paper & Paperboard, Plastic Waste, Glass Waste, Metal Waste, Others |
| By Service Type | Collection & Transportation, Segregation & Sorting, Recycling, Biological Treatment (Composting & Bio-methanation), Disposal |
| By End user | Residential, Commercial, Industrial |
India Municipal Solid Waste Management Market Growth Drivers
Escalating Waste Generation from Commercial, Industrial, and Institutional Sectors Widening the Municipal Collection and Processing Gap
India's commercial, industrial, and institutional sectors are generating waste at a pace that structurally outpaces existing municipal collection infrastructure, making this the primary demand driver for the municipal solid waste management market. The Ministry of Environment, Forest and Climate Change (MoEFCC) notified the Solid Waste Management Rules, 2026 effective April 1, 2026 introducing the Extended Bulk Waste Generator Responsibility (EBWGR) framework, mandating that establishments with a floor area of 20,000 square meters or more, water consumption of 40,000 liters per day, or waste generation of 100 kg per day must independently arrange scientifically compliant collection, segregation, and processing. This shift directly expands the addressable market for private waste operators beyond municipal contracts into commercial and institutional procurement.
The scale of industrial waste streams compounds this structural pressure. According to Central Pollution Control Board (CPCB) data shared in Parliament in August 2025, India generated 13.97 lakh metric tonnes of e-waste in FY 2024–25, up from 12.54 lakh metric tonnes in FY 2023–24 an 11% year-on-year increase, with 11.59 lakh metric tonnes formally recycled, leaving a residual unmanaged volume that municipal systems must absorb. This demonstrate the significant requirement for e-waste management in India. As manufacturing output and retail expansion accelerate, commercial waste volumes will continue scaling faster than legacy urban local body capacity, sustaining long-term demand for integrated collection and processing infrastructure.
Recent Trends
Rising Adoption of Bioenergy Recovery from Organic Municipal Solid Waste Replacing Conventional Landfill Disposal
India's municipal solid waste management industry is witnessing a structural transition from landfill-dependent disposal to resource recovery and bioenergy generation, creating significant growth opportunities for waste management service providers. This shift is being driven by supportive government policies, increasing investments in waste-to-energy infrastructure, and the commercialization of bio-methanation technologies that convert organic municipal solid waste into Compressed Biogas (CBG). According to the Ministry of New and Renewable Energy (MNRE), 59 CBG plants with a cumulative production capacity of 684.33 tonnes per day were commissioned during 2025 (through November), alongside 12 bio-power plants with a combined installed capacity of 89.86 MW. These developments highlight the growing adoption of municipal solid waste as a reliable feedstock for renewable energy production.
Private sector participation is further accelerating market expansion. In December 2025, Indraprastha Gas Limited entered a 50:50 joint venture with Hindustan Waste Treatment to establish CBG plants utilizing municipal solid waste, reflecting increasing integration between waste processing and city gas distribution networks. In March 2026, the Government of Andhra Pradesh approved USD 7.23 million to develop five CBG plants with a combined processing capacity of 125 tonnes per day across urban local bodies. Furthermore, the implementation of the Compressed Biogas Obligation (CBO) is expected to ensure long-term demand for bio-CNG, encouraging investments in source segregation, bio-methanation facilities, gas upgrading technologies, and integrated organic waste management infrastructure across India's urban centers through 2032.
Opportunities and Challenges
Weak Formal Recycling Infrastructure Leading to EPR-Mandated Investment in Digital Traceability and Organized Recycling Networks
One of the most significant market challenge in municipal solid waste management market is the India's formal recycling infrastructure, that remains structurally underdeveloped relative to waste volumes generated. According to a Parliament reply by the Ministry of Environment, Forest and Climate Change (MoEFCC) in March 2026, only 978 plastic waste management units were operational as of December 2024, and despite 207 lakh tonnes of plastic packaging waste recycled since EPR guidelines came into force in 2022, the Central Pollution Control Board (CPCB) issued Show Cause Notices on November 25, 2024, December 30, 2024, and March 11, 2026 to registered Producers, Importers and Brand Owners for non-fulfilment of EPR targets — confirming formal recycling capacity remains insufficient to absorb mandated volumes across waste streams.
The same compliance deficit is directly converting into private capital deployment. In June 2025, Attero Recycling announced a USD 12 million investment to scale its rare earth recycling capacity from 300 to 30,000 tonnes annually, explicitly aligning with the Government of India's National Critical Mineral Mission to build domestic formal recycling infrastructure.
Further, the MoEFCC notified the Plastic Waste Management Amendment Rules, 2026 on March 31, 2026, introducing mandatory recycled content targets and Registered Environment Auditors as third-party verifiers to eliminate fraudulent EPR certificates, creating enforceable demand for certified formal recycling facilities and digital traceability systems through 2032.
Segmentation Insights
Collection & Transportation Remains the Backbone of Municipal Solid Waste Management in India
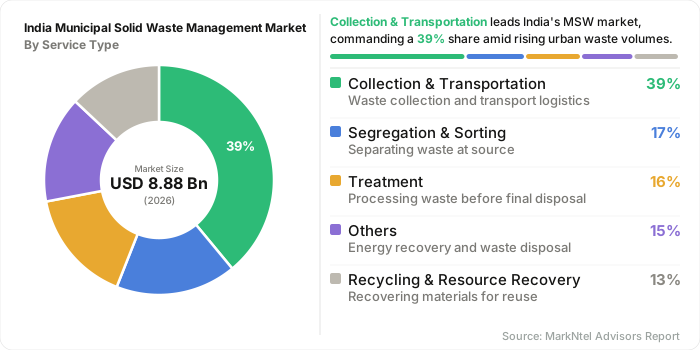
Collection & Transportation (C&T) commands a 39% share of India's municipal solid waste management market, making it the largest service category by revenue. The segment's dominance reflects a structural reality: waste that is not collected cannot be processed, treated, or disposed of, making C&T the mandatory gateway through which every other service function depends. India generates approximately 62 million tonnes of municipal solid waste annually, with collection rates ranging from below 50% in small cities to 70–90% in large cities, creating an enormous and still-expanding addressable base for C&T service providers. The capital intensity of the segment, requiring purpose-built fleets, route-planning systems, and 24-hour operational crews — creates high contract values and long concession periods that structurally favor established operators over fragmented informal collection networks.
Demand for C&T services has been directly amplified by the Government of India's Swachh Bharat Mission-Urban 2.0, which runs through 2025–26 and mandates door-to-door waste collection across all 4,372 urban local bodies (ULBs). As per MoHUA data, over 3,600 ULBs participated in the Swachhta Survekshan, and over 96% of urban wards now have 100% door-to-door waste collection. This policy mandate has converted collection from a discretionary municipal function into a legally enforceable service obligation, directly expanding the contracted C&T market.
Antony Waste Handling Cell exemplifies the commercial scale this creates: in December 2025, its subsidiary AG Enviro Infra Projects secured two seven-year C&T contracts from the Brihanmumbai Municipal Corporation valued at a combined USD 155 million, covering the daily collection and transportation of approximately 1,250 metric tonnes of municipal solid waste across key Mumbai wards. As urban populations and waste volumes continue to grow, and as ULBs deepen contract-based outsourcing, C&T will retain its position as the highest-revenue segment anchoring market expansion ahead of all downstream service categories. By Service type the market is further segmented into the following sub-categories:
- Collection & Transportation
- Segregation & Sorting
- Treatment
- Recycling & Resource Recovery
- Energy Recovery
- Disposal
Organic/Biodegradable Waste Accounts for the Largest Share of India's Municipal Solid Waste Stream
Organic and biodegradable waste accounts for approximately 55% of India's total municipal solid waste stream, making it the largest waste-type segment by volume. This leadership stems from high levels of food and kitchen waste generated across dense urban households, wholesale food markets, and the expanding commercial food-service sector, where moisture-heavy waste outweighs drier, recyclable fractions in daily collections. CPCB data for 2022–23 show India generated about 171,000 tonnes per day of municipal solid waste, with 96 percent collected but only around 61 percent scientifically processed, exposing the processing gap that organic-stream infrastructure must close.
Plastic waste is the fastest-scaling sub-segment by processing investment, driven by Extended Producer Responsibility enforcement. Around 207 lakh tonnes of plastic packaging waste have been recycled since the EPR Guidelines took effect in 2022. Parallel momentum is visible in organic valorization, with over 1,100 Gobardhan biogas plants now operational nationwide, converting wet waste into Bio-CNG and manure, reinforcing the segment's continued volume leadership. Based on waste type, the market is segmented into:
- Organic/Biodegradable Waste
- Paper & Paperboard
- Plastic Waste
- Glass Waste
- Metal Waste
- Others
India Municipal Solid Waste Management Market Geographical Analysis
North India holds a 30% share of India's municipal solid waste management market, the largest regional contribution, driven primarily by the concentration of high-density urban agglomerations across Delhi, Uttar Pradesh, Punjab, Rajasthan, and Haryana. The region's structural position as a demand anchor stems from the sheer scale of waste volumes generated by its megacities and rapidly expanding secondary urban centres.
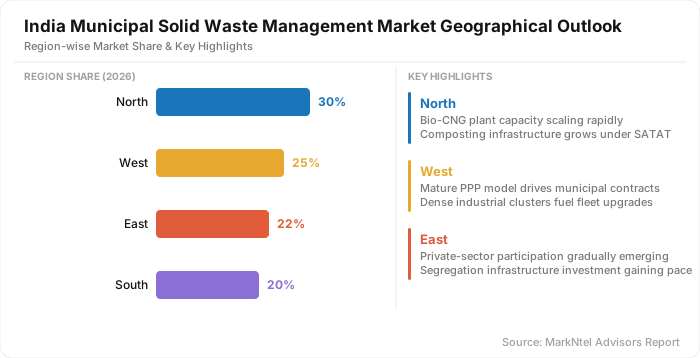
Delhi alone generates approximately 11,500 metric tonnes of municipal solid waste per day, with the Municipal Corporation of Delhi operating four waste-to-energy plants at Narela-Bawana, Okhla, Tehkhand, and Ghazipur with a combined processing capacity of 6,550 TPD. To close the remaining processing gap, the MCD announced in November 2025 the development of four additional MSW processing facilities at Bhalswa (1,800 TPD), Singhola (700 TPD), Okhla (1,400 TPD), and Narela-Bawana (1,200 TPD) at a total estimated cost of USD 42 million. Uttar Pradesh further reinforces regional demand through its 66-city coverage under the Atal Mission for Rejuvenation and Urban Transformation (AMRUT) and 10 Smart Cities developed under the Smart Cities Mission, each mandating upgraded solid waste infrastructure.
As North India's urban population continues to expand and compliance requirements under the Solid Waste Management Rules 2026 tighten across all ULBs, the region is positioned to sustain its dominant share through sustained public capital deployment in processing and disposal infrastructure. Collectively, rising urban waste generation, expanding processing infrastructure, and sustained government investment are expected to reinforce North India's leadership in the India municipal solid waste management market.
India Municipal Solid Waste Management Market Competitive Landscape
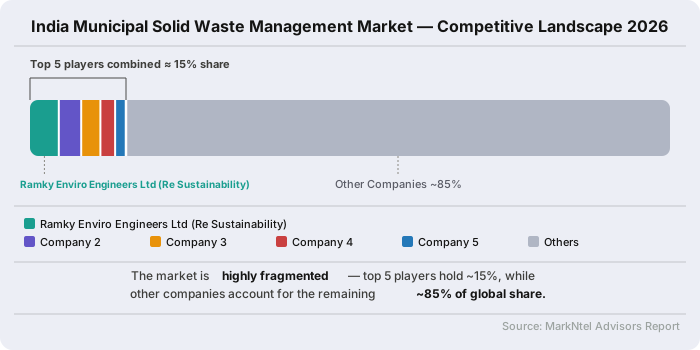
The Municipal Solid Waste Management Industry in India is moderately fragmented, with Government and Municipal Urban Local Bodies (ULBs) accounting for the majority of operations, while private participation continues to expand through public-private partnership (PPP) projects, long-term concession agreements, and integrated waste management contracts. Top five players in the market include, Ramky Enviro Engineers Ltd (Re Sustainability), Antony Waste Handling Cell Ltd, BVG India Ltd, and Eco green Energy Pvt. Ltd., collectively holding a share of 15% in 2026.
Major players in India Municipal Solid Waste Management
- Ramky Enviro Engineers Ltd (Re Sustainability)
- Antony Waste Handling Cell Ltd
- BVG India Ltd
- Ecogreen Energy Pvt Ltd
- IL&FS Environmental Infrastructure & Services Ltd
- Jindal ITF Urban Infrastructure Ltd (TOWMCL)
- A2Z Green Waste Management Ltd
- Hanjer Biotech Energies Pvt Ltd
- Ecowise Waste Management Pvt Ltd
- Tatva Global Environment Ltd
India Municipal Solid Waste Management Market News and Recent Developments
2024: Gorakhpur Municipal Corporation Partners with NTPC to Develop India's First Integrated Waste Management City in Uttar Pradesh
Gorakhpur Municipal Corporation signed a Memorandum of Understanding with National Thermal Power Corporation (NTPC) for an investment of INR 300 crore to develop India's first Integrated Waste Management City-cum-Learning Centre across 40 acres in Suthni village, Sahjanwa, targeting commissioning by September 2025. The project comprises three dedicated plants: a Dry Waste Plant with 500 tonnes per day (TPD) capacity producing charcoal; a Wet Waste Plant of 200 TPD generating Bio-CNG under PPP model, projected to save Gorakhpur Municipal Corporation INR 12–15 crore monthly on vehicle fuel; and a Hazardous Waste Plant for domestic hazardous waste. The facility will additionally serve eight neighbouring Urban Local Bodies.
Impact analysis: NTPC's INR 300 crore entry into integrated municipal waste processing signals that large public sector utilities are entering the India MSW market as capital partners, expanding investment sources beyond traditional ULB budgets and multilateral lenders. The 700 TPD combined plant capacity across three waste streams establishes a regional multi-ULB service model that, if replicated, would materially increase demand for integrated waste processing equipment and Bio-CNG infrastructure across Tier 2 cities.
2025: AISmart Bin Launches BinPro AI-Powered Waste Segregation System at Bengaluru Tech Summit 2025 for Deployment Across Indian Public Infrastructure
Bengaluru-based startup AISmart Bin unveiled BinPro — an AI-powered, six-compartment waste segregation bin — at the Bengaluru Tech Summit 2025 in November 2025. The system uses AI sensors to identify waste type — plastic, glass, or organic — and automatically opens the correct compartment, achieving up to 95% sorting accuracy without manual intervention. The 400-litre model is priced between INR 40,000 and INR 1.5 lakh per unit, with patent protection secured, and initial deployment targeted at airports, railway stations, and large commercial centres. AISmart Bin is simultaneously developing a fully automated mixed and dry waste processing system combining AI imaging, robotic mechanisms, and conveyor-based sorting — with a patent currently under review.
Impact analysis: BinPro's commercial launch introduces sensor-driven automated segregation as a deployable product at a price point accessible to municipal corporations and private facility managers — directly addressing the source segregation compliance gap that currently constrains feedstock quality for downstream recycling and waste-to-energy operators. Widespread deployment across high-footfall public infrastructure would materially improve waste stream purity, reducing contamination costs for processing plant operators and strengthening the economics of formal material recovery at scale.
- Market Segmentation
- Introduction
- Product Definition
- Research Process
- Assumptions
- Executive Summary
- India Municipal Solid Waste Management Market Policies, Regulations, and Product Standards
- India Municipal Solid Waste Management Market Trends & Developments
- India Municipal Solid Waste Management Market Dynamics
- Growth Factors
- Challenges
- India Municipal Solid Waste Management Market Hotspot & Opportunities
- India Municipal Solid Waste Management Market Outlook, 2022-2032F
- Market Size & Outlook
- By Revenues (USD Million)
- Market Share & Outlook
- By Waste Type- Market Size & Forecast 2022-2032, USD Million
- Organic/Biodegradable Waste
- Paper & Paperboard
- Plastic Waste
- Glass Waste
- Metal Waste
- Others
- By Service Type- Market Size & Forecast 2022-2032, USD Million
- Collection & Transportation
- Segregation & Sorting
- Recycling
- Biological Treatment (Composting & Bio-methanation)
- Disposal
- By End user - Market Size & Forecast 2022-2032, USD Million
- Residential
- Commercial
- Industrial
- By Region - Market Size & Forecast 2022-2032, USD Million
- North
- National Capital Region (NCR)
- Uttar Pradesh
- Punjab
- Rajasthan
- Others
- South
- Karnataka
- Tamil Nadu
- Kerala
- others
- East
- West Bengal
- Odisha
- others
- West
- Maharashtra
- Gujarat
- Madhya Pradesh
- others
- North
- By Company
- Competition Characteristics
- Market Share & Analysis
- By Waste Type- Market Size & Forecast 2022-2032, USD Million
- Market Size & Outlook
- India Municipal Paper & Paperboard Waste Management Market Outlook, 2022-2032
- Market Size & Outlook
- By Revenues (USD Million)
- Market Share & Outlook
- By Waste Type- Market Size & Forecast 2022-2032, USD Million
- By Service Type- Market Size & Forecast 2022-2032, USD Million
- By Ownership / Operating Model- Market Size & Forecast 2022-2032, USD Million
- By Region - Market Size & Forecast 2022-2032, USD Million
- Market Size & Outlook
- India Municipal Metal Waste Management Market Outlook, 2022-2032
- Market Size & Outlook
- By Revenues (USD Million)
- Market Share & Outlook
- By Waste Type- Market Size & Forecast 2022-2032, USD Million
- By Service Type- Market Size & Forecast 2022-2032, USD Million
- By Ownership / Operating Model- Market Size & Forecast 2022-2032, USD Million
- By Region - Market Size & Forecast 2022-2032, USD Million
- Market Size & Outlook
- India Municipal Plastic Waste Management Market Outlook, 2022-2032
- Market Size & Outlook
- By Revenues (USD Million)
- Market Share & Outlook
- By Waste Type- Market Size & Forecast 2022-2032, USD Million
- By Service Type- Market Size & Forecast 2022-2032, USD Million
- By Ownership / Operating Model- Market Size & Forecast 2022-2032, USD Million
- By Region - Market Size & Forecast 2022-2032, USD Million
- Market Size & Outlook
- India Municipal Glass Waste Management Market Outlook, 2022-2032
- Market Size & Outlook
- By Revenues (USD Million)
- Market Share & Outlook
- By Waste Type- Market Size & Forecast 2022-2032, USD Million
- By Service Type- Market Size & Forecast 2022-2032, USD Million
- By Ownership / Operating Model- Market Size & Forecast 2022-2032, USD Million
- By Region - Market Size & Forecast 2022-2032, USD Million
- Market Size & Outlook
- India Municipal Organic/Biodegradable Waste Management Market Outlook, 2022-2032
- Market Size & Outlook
- By Revenues (USD Million)
- Market Share & Outlook
- By Waste Type- Market Size & Forecast 2022-2032, USD Million
- By Service Type- Market Size & Forecast 2022-2032, USD Million
- By Ownership / Operating Model- Market Size & Forecast 2022-2032, USD Million
- By Region - Market Size & Forecast 2022-2032, USD Million
- Market Size & Outlook
- India Municipal Solid Waste Management Market Key Strategic Imperatives for Success & Growth
- Competitive Outlook
- Company Profiles
- Ramky Enviro Engineers Ltd (Re Sustainability)
- Business Description
- Product Portfolio
- Collaborations & Alliances
- Recent Developments
- Financial Details
- Others
- Antony Waste Handling Cell Ltd
- Business Description
- Product Portfolio
- Collaborations & Alliances
- Recent Developments
- Financial Details
- Others
- BVG India Ltd
- Business Description
- Product Portfolio
- Collaborations & Alliances
- Recent Developments
- Financial Details
- Others
- Ecogreen Energy Pvt Ltd
- Business Description
- Product Portfolio
- Collaborations & Alliances
- Recent Developments
- Financial Details
- Others
- IL&FS Environmental Infrastructure & Services Ltd
- Business Description
- Product Portfolio
- Collaborations & Alliances
- Recent Developments
- Financial Details
- Others
- Jindal ITF Urban Infrastructure Ltd (TOWMCL)
- Business Description
- Product Portfolio
- Collaborations & Alliances
- Recent Developments
- Financial Details
- Others
- A2Z Green Waste Management Ltd
- Business Description
- Product Portfolio
- Collaborations & Alliances
- Recent Developments
- Financial Details
- Others
- Hanjer Biotech Energies Pvt Ltd
- Business Description
- Product Portfolio
- Collaborations & Alliances
- Recent Developments
- Financial Details
- Others
- Ecowise Waste Management Pvt Ltd
- Business Description
- Product Portfolio
- Collaborations & Alliances
- Recent Developments
- Financial Details
- Others
- Tatva Global Environment Ltd
- Business Description
- Product Portfolio
- Collaborations & Alliances
- Recent Developments
- Financial Details
- Others
- Ramky Enviro Engineers Ltd (Re Sustainability)
- Company Profiles
- Disclaimer

MarkNtel Advisors follows a robust and iterative research methodology designed to ensure maximum accuracy and minimize deviation in market estimates and forecasts. Our approach combines both bottom-up and top-down techniques to effectively segment and quantify various aspects of the market. A consistent feature across all our research reports is data triangulation, which examines the market from three distinct perspectives to validate findings. Key components of our research process include:
1. Scope & Research Design At the outset, MarkNtel Advisors define the research objectives and formulate pertinent questions. This phase involves determining the type of research—qualitative or quantitative—and designing a methodology that outlines data collection methods, target demographics, and analytical tools. They also establish timelines and budgets to ensure the research aligns with client goals.
2. Sample Selection and Data Collection In this stage, the firm identifies the target audience and determines the appropriate sample size to ensure representativeness. They employ various sampling methods, such as random or stratified sampling, based on the research objectives. Data collection is carried out using tools like surveys, interviews, and observations, ensuring the gathered data is reliable and relevant.
3. Data Analysis and Validation Once data is collected, MarkNtel Advisors undertake a rigorous analysis process. This includes cleaning the data to remove inconsistencies, employing statistical software for quantitative analysis, and thematic analysis for qualitative data. Validation steps are taken to ensure the accuracy and reliability of the findings, minimizing biases and errors.

4. Data Forecast and FinalizationThe final phase involves forecasting future market trends based on the analyzed data. MarkNtel Advisors utilize predictive modeling and time series analysis to anticipate market behaviors. The insights are then compiled into comprehensive reports, featuring visual aids like charts and graphs, and include strategic recommendations to inform client decision-making
We’d love to understand what matters most to you.