

By Product Type (Urea, Ammonium Nitrate, Ammonium Sulfate, Calcium Ammonium Nitrate (CAN), Urea Ammonium Nitrate (UAN), Anhydrous Ammonia, Aqua Ammonia, Ammonium Chloride, Others), By Form (Solid, Liq... ... By Form (Solid, Liquid), By Application Method (Soil Application, Fertigation, Foliar Spray), By Crop Type (Cereals & Grains, Oilseeds, Sugarcane, Fruits & Vegetables, Coffee, Turf & Ornamentals, Others), and others Read more
- Environment
- Jul 2026
- 140
- PDF, Excel, PPT
Brazil Nitrogenous Fertilizers Market Key Takeaways
- The Brazil nitrogenous fertilizers market was valued at USD 67.4 billion in 2025 and is projected to grow from USD 71.9 billion in 2026 to USD 127.82 billion by 2032, registering a CAGR of 10.06% during the forecast period (2026–2032).
- Urea dominates the market with an estimated 62% share by product type.
- Solid fertilizers account for nearly 94% of market demand by form.
- The market is moderately fragmented, with top five companies collectively accounting for approximately 44% of the market.
Brazil Nitrogenous Fertilizers Market Size and Outlook
The nitrogenous fertilizers market in Brazil was valued at USD 67.4 billion in 2025 and is projected to grow to USD 127.82 billion by 2032, registering a CAGR of 10.06% during the forecast period. Market growth is primarily driven by Brazil's expanding agricultural sector, particularly the continued rise in soybean, corn, and cotton cultivation, which fuels strong demand for nitrogen-based fertilizers.
According to Brazil's National Supply Company (Conab), the country harvested a record 350.2 million tons of grains in the 2024/25 season, including 171.4 million tons of soybeans cultivated across 47.35 million hectares and 139.7 million tons of corn. Fertilizers represented approximately 23% of total production costs for soybean, corn, and cotton farming in 2024, underscoring the critical role of nitrogen fertilizers in sustaining crop productivity and maximizing yields.
Brazil's nitrogenous fertilizer industry remains heavily dependent on imports, making supply security a key industry concern. The country imported a record 44.3 million tons of fertilizers in 2024, an increase of 8.3% compared to 2023. Approximately 95% of the nitrogen used in Brazilian agriculture is imported, while urea, the country's most widely consumed nitrogen fertilizer, is sourced almost entirely from international suppliers. Annual urea consumption is estimated at around 8 million tons, with nearly 40% of demand concentrated in the Central-West region, where extensive cultivation of corn, sugarcane, cotton, and pasture crops drives fertilizer consumption. This high dependence on imported nitrogen products leaves the market vulnerable to global price fluctuations and exchange rate movements.
To strengthen domestic fertilizer security, the Brazilian government is accelerating investments under the National Fertilizer Plan, which aims to reduce fertilizer import dependence from approximately 85% to 50% by 2050. Supporting this objective, Petrobras restarted operations at the Fafen-SE plant in December 2025 and the Fafen-BA plant in January 2026. In April 2026, the company also approved an investment of nearly USD 1 billion to complete the UFN-III ammonia and urea complex in Três Lagoas, which is expected to supply approximately 35% of Brazil's domestic urea demand by 2029.
Alongside capacity expansion, Brazil is also advancing the transition toward low-carbon fertilizer production. In 2024, Petrobras and Yara Brasil Fertilizantes signed strategic agreements to develop renewable and low-carbon fertilizers, supporting the commercialization of green ammonia and helping reduce carbon emissions across the agricultural value chain. Backed by record crop production, rising investments in domestic manufacturing, and growing adoption of sustainable fertilizer technologies, the Brazil nitrogenous fertilizers industry is well positioned for sustained long-term growth through 2032.
Brazil Nitrogenous Fertilizers Market Key Indicators
- According to Brazil's National Supply Company (CONAB), the country's 2025/26 grain and oilseed harvest is projected to reach a record 358.6 million tonnes, an increase of 6.4 million tonnes over the previous season. National average productivity is expected to rise to 4,295 kg per hectare, reflecting continued improvements in agricultural efficiency. The expansion in cultivated acreage across major crops such as corn, rice, and sorghum is expected to significantly increase the demand for nitrogenous fertilizers, particularly for topdressing applications, reinforcing market growth during the forecast period.
- CONAB data show first-harvest corn production climbing 18% year on year to 29.3 million tonnes in 2025/26, with productivity reaching a record 7,110 kg per hectare. This yield gain was achieved through more intensive input use rather than area expansion alone. Higher productivity targets of this kind typically require split nitrogen dosing at multiple growth stages, which directly supports rising consumption of urea and ammonium sulfate across corn-growing states in southern Brazil.
Brazil Nitrogenous Fertilizers Market Scope
| Category | Segments |
|---|---|
| By Product Type | Urea, Ammonium Nitrate, Ammonium Sulfate, Calcium Ammonium Nitrate (CAN), Urea Ammonium Nitrate (UAN), Anhydrous Ammonia, Aqua Ammonia, Ammonium Chloride, Others |
| By Form | Solid, Liquid |
| By Application Method | Soil Application, Fertigation, Foliar Spray |
| By Crop Type | Cereals & Grains, Oilseeds, Sugarcane, Fruits & Vegetables, Coffee, Turf & Ornamentals, Others |
Brazil Nitrogenous Fertilizers Market Growth Drivers
Corn Ethanol Expansion Driving Nitrogen-Intensive Second-Crop Corn Cultivation
The rapid expansion of Brazil's corn ethanol industry is significantly increasing demand for nitrogenous fertilizers by encouraging greater cultivation of nitrogen-intensive corn. As Compared with soybeans, which naturally fix atmospheric nitrogen, corn requires substantial nitrogen applications, particularly urea for topdressing, making each additional hectare of cultivation a recurring source of fertilizer demand.
According to the National Corn Ethanol Union (UNEM), Brazil's corn ethanol production is projected to approach 10 billion liters in the 2025/26 season, up from 8.2 billion liters in 2024/25, reflecting robust growth in ethanol processing capacity and feedstock consumption. The U.S. Department of Agriculture (USDA) reports that Brazil had 31 operational corn ethanol plants with a combined annual capacity of 11 billion liters as of December 2025, while 18 additional plants were under construction, primarily in Mato Grosso, the country's leading safrinha corn-producing state.
Moreover, the proposed increase in the gasoline ethanol blend from E27 to E30 could add 1.3 billion liters to annual ethanol demand, further stimulating corn production and reinforcing long-term consumption of nitrogen fertilizers across Brazil's Center-West agricultural region.
Recent Trends
Enhanced-Efficiency and Controlled-Release Nitrogen Fertilizers Gaining Traction
Brazilian growers are increasingly adopting enhanced-efficiency fertilizers (EEFs) and controlled-release nitrogen fertilizers to improve nitrogen use efficiency, reduce volatilization losses, and optimize fertilizer applications across large-scale cropping systems. This trend is being driven by rising fertilizer costs, precision agriculture adoption, and the need to improve productivity in soybean, corn, and sugarcane cultivation.
In 2025, Haifa Group strengthened its presence in Brazil by introducing its CoteN® controlled-release nitrogen fertilizer ranges through its new blending facility in Uberlândia, Minas Gerais. The polymer-coated technology is designed to release nitrogen gradually, reducing nutrient losses and lowering application requirements compared with conventional urea.
In 2026, ICL Brasil expanded the availability of its Agromaster® controlled-release fertilizer portfolio for Brazilian agriculture, offering coated nitrogen formulations that improve nutrient availability throughout the crop growth cycle while supporting precision nutrient management. As producers increasingly seek higher fertilizer efficiency and lower environmental losses, the adoption of coated and stabilized nitrogen fertilizers is expected to accelerate across Brazil's commercial grain production, transforming premium nitrogen products from niche offerings into mainstream crop nutrition solutions.
Brazil Nitrogenous Fertilizers Market Opportunities and Challenges
Port Congestion and Logistics Bottlenecks Driving Northern Arc and Inland Blending Investments
Brazil's heavy reliance on imported nitrogen fertilizers has made efficient logistics a critical factor in ensuring timely supply to agricultural regions. Most urea and other nitrogen fertilizers enter the country through the southern ports of Santos and Paranaguá, where fertilizer imports compete with record grain exports for port capacity, storage, and transportation infrastructure. In March 2025, around 55% of vessels calling at major Brazilian ports experienced delays or rescheduling, with waiting times of up to 10 days at the Port of Santos. Limited infrastructure investment has further strained the supply chain, increasing transportation costs and delaying fertilizer deliveries during peak planting seasons.
These challenges are accelerating investment in Brazil's Northern Arc logistics corridor, which offers shorter transportation routes to major agricultural states such as Mato Grosso and Pará. Fertilizer throughput at Northern Arc ports increased from 5.97 million tonnes in 2023 to 7.52 million tonnes in 2024, reflecting the growing importance of these corridors. Supporting this shift, the federal government allocated USD 4.8 billion in 2025 under the New Growth Acceleration Program to improve waterway navigability and strengthen northern logistics infrastructure. Complementing these initiatives, Mosaic Fertilizantes inaugurated a 1 million-tonne fertilizer blending facility in Palmeirante, Tocantins, in July 2025, improving regional distribution efficiency. Together, these investments are expected to lower logistics costs, strengthen fertilizer availability, and create significant growth opportunities for nitrogen fertilizer companies serving Brazil's expanding agricultural frontier.
Segmentation Insights
Urea to Lead the Industry with Potential Market Share
Urea accounts for roughly 62% of Brazil's nitrogenous fertilizers market by product type, making it the largest segment. Its leadership is attributed to its high nitrogen concentration of about 46% by weight, the highest among solid nitrogen fertilizers, which lowers the cost, freight, and storage burden per unit of nitrogen. This makes urea particularly well suited for Brazil's long inland transportation routes to the Center-West and northern agricultural regions. In addition, urea is highly versatile, supporting broadcast, bulk-blend, and fluid application systems, while also serving as the feedstock for ARLA 32, a 32.5% high-purity urea solution used in diesel Selective Catalytic Reduction (SCR) systems, extending its demand beyond agricultural applications.
Industry investments continue to reinforce urea's market leadership. In September 2025, Petrobras signed a five-year operations and maintenance contract with Engeman for its Sergipe (FAFEN-SE) and Bahia (FAFEN-BA) nitrogen fertilizer complexes.
Together, these facilities have an installed urea production capacity exceeding 1.1 million tonnes per year, including 650,000 tonnes at FAFEN-SE and 475,000 tonnes at FAFEN-BA, while also producing ARLA 32 and operating the Ammonia and Urea Maritime Terminals at Aratu Port. Granular urea, valued for its uniform spreading in mechanized row-crop systems, remains the fastest-growing format, while liquid UAN continues to gain adoption in fertigation applications. As domestic production capacity and dedicated terminal logistics continue to expand, urea is expected to further strengthen its structural leadership in Brazil's nitrogenous fertilizers market throughout the forecast period. By product type the market is further segmented into the following sub-categories:
- Urea
- Ammonium Nitrate
- Ammonium Sulfate
- Calcium Ammonium Nitrate (CAN)
- Urea Ammonium Nitrate (UAN)
- Anhydrous Ammonia
- Aqua Ammonia
- Ammonium Chloride
- Others
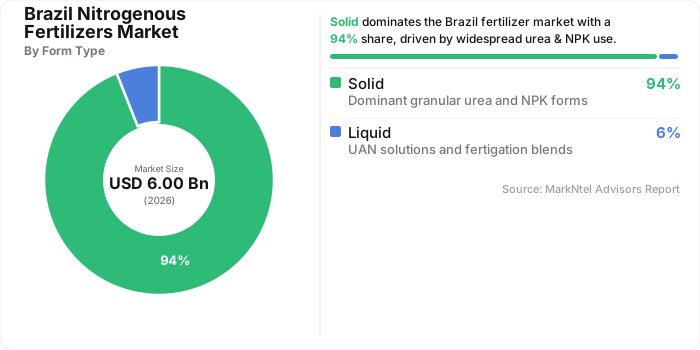
Solid Fertilizers Maintain Leadership in Brazil's Nitrogenous Fertilizers Market
Solid fertilizers account for roughly 94% of Brazil's nitrogenous fertilizers industry, making them the dominant segment. Granular and prilled fertilizers can be stored for extended periods, transported efficiently in bulk without requiring pressurized tanks, and applied using high-capacity broadcast spreaders across Brazil's highly mechanized grain farms. They also form the backbone of the country's import-and-blend fertilizer model, where imported straight fertilizers are processed into customized granular NPK formulations at dedicated blending facilities. Reflecting the scale of this network, EuroChem operates 18 blending and distribution units across Brazil, all designed to handle solid fertilizer products.
Industry investments continue to strengthen the segment's leadership. In Brazil's North–Northeast corridor, EuroChem invested USD 23 million to expand its blending facilities in Barcarena, São Luís, and Candeias, with the São Luís plant set to more than double its capacity to 290,000 tonnes to support fertilizer distribution through the Port of Itaqui. The company also announced a USD 12.6 million storage expansion near Brazil's southern ports in 2025. While liquid fertilizers are gaining adoption in fertigation and specialty crop production, granular and prilled solid fertilizers continue to offer superior logistics, storage, and cost advantages for large-scale soybean and corn cultivation, ensuring their long-term market leadership. By form the market is further segmented into the following sub-categories:
- Solid
- Liquid
Brazil Nitrogenous Fertilizers Market Competitive Landscape
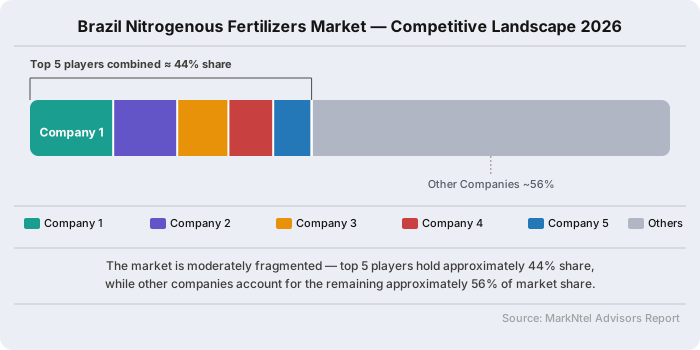
The Brazil Nitrogenous Fertilizers Market is moderately fragmented, with the top five players accounting for approximately 44% of the market. Leading companies include Yara Brasil Fertilizantes, The Mosaic Company, EuroChem Fertilizantes Tocantins, Petrobras, and Unigel. Competition is driven by domestic production, fertilizer imports, distribution networks, blending capabilities, and strategic capacity expansion initiatives.
Major players in the Brazil Nitrogenous Fertilizers Market
- Yara Brasil Fertilizantes
- The Mosaic Company
- EuroChem Fertilizantes Tocantins
- Petrobras
- Unigel
- Fertipar Fertilizantes
- Cibra Fertilizantes
- Fertilizantes Heringer
- Timac Agro Brasil
Brazil Nitrogenous Fertilizers Market News and Recent Developments
2024: Atlas Agro Begins Construction of Green Hydrogen Nitrogen Plant in Uberaba
Swiss company Atlas Agro announced construction of Brazil's first nitrogen fertilizer factory built on green hydrogen technology, located in Uberaba, representing an investment of approximately USD 4.3 billion, with the announcement made on 2024.
Market Impact Analysis: The plant introduces low-carbon nitrogen supply into Minas Gerais, giving early-mover positioning to sustainability-focused buyers and setting a domestic decarbonization benchmark against gas-based ammonia producers still reliant on conventional feedstock.
2026: Petrobras Restarts Sergipe Nitrogen Complex with USD 13.88 Billion Regional Investment
President Lula visited the Fafen-SE nitrogen plant in Laranjeiras, Sergipe, on May 29, 2026, where Petrobras announced an investment exceeding (USD 13.88 billion) in the state, covering the fertilizer plant alongside oil and gas exploration, generating 28,000 direct and indirect jobs. Ammonia production resumed in December 2025, with urea output following in January 2026.
Market Impact Analysis: The Sergipe restart re-establishes domestic ammonia-to-urea supply capacity in Brazil's Northeast, strengthening local distribution reach for agribusiness buyers and reducing reliance on seaborne urea imports into that region.
Enhanced-Efficiency and Controlled-Release Nitrogen Fertilizers Gaining Traction is the key trend in the Brazil Nitrogenous Fertilizers market.
What are the growth opportunities driving the Brazil Nitrogenous Fertilizers Market?
Port Congestion and Logistics Bottlenecks Driving Northern Arc and Inland Blending Investments in the Brazil Nitrogenous Fertilizers Market.
- Market Segmentation
- Introduction
- Product Definition
- Research Process
- Assumptions
- Executive Summary
- Brazil Nitrogenous Fertilizers Market Policies, Regulations, and Product Standards
- Brazil Nitrogenous Fertilizers Market Trends & Developments
- Brazil Nitrogenous Fertilizers Market Dynamics
- Growth Factors
- Challenges
- Brazil Nitrogenous Fertilizers Market Hotspot & Opportunities
- Brazil Nitrogenous Fertilizers Market Outlook, 2022-2032
- Market Size & Outlook
- By Revenues (USD Million)
- Market Share & Outlook
- By Product Type- Market Size & Forecast 2022-2032, USD Million
- Urea
- Ammonium Nitrate
- Ammonium Sulfate
- Calcium Ammonium Nitrate (CAN)
- Urea Ammonium Nitrate (UAN)
- Anhydrous Ammonia
- Aqua Ammonia
- Ammonium Chloride
- Others
- By Form- Market Size & Forecast 2022-2032, USD Million
- Solid
- Liquid
- By Application Method- Market Size & Forecast 2022-2032, USD Million
- Soil Application
- Fertigation
- Foliar Spray
- By Crop Type- Market Size & Forecast 2022-2032, USD Million
- Cereals & Grains
- Oilseeds
- Sugarcane
- Fruits & Vegetables
- Coffee
- Turf & Ornamentals
- Others
- By Region - Market Size & Forecast 2022-2032, USD Million
- North
- South
- East
- West
- Central
- By Company
- Competition Characteristics
- Market Share & Analysis
- By Product Type- Market Size & Forecast 2022-2032, USD Million
- Market Size & Outlook
- Brazil Urea Market Outlook, 2022-2032
- Market Size & Outlook
- By Revenues (USD Million)
- Market Share & Outlook
- By Form- Market Size & Forecast 2022-2032, USD Million
- By Application Method- Market Size & Forecast 2022-2032, USD Million
- By Crop Type- Market Size & Forecast 2022-2032, USD Million
- By Region - Market Size & Forecast 2022-2032, USD Million
- Market Size & Outlook
- Brazil Ammonium Nitrate Market Outlook, 2022-2032
- Market Size & Outlook
- By Revenues (USD Million)
- Market Share & Outlook
- By Form- Market Size & Forecast 2022-2032, USD Million
- By Application Method- Market Size & Forecast 2022-2032, USD Million
- By Crop Type- Market Size & Forecast 2022-2032, USD Million
- By Region - Market Size & Forecast 2022-2032, USD Million
- Market Size & Outlook
- Brazil Ammonium Sulfate Market Outlook, 2022-2032
- Market Size & Outlook
- By Revenues (USD Million)
- Market Share & Outlook
- By Form- Market Size & Forecast 2022-2032, USD Million
- By Application Method- Market Size & Forecast 2022-2032, USD Million
- By Crop Type- Market Size & Forecast 2022-2032, USD Million
- By Region - Market Size & Forecast 2022-2032, USD Million
- Market Size & Outlook
- Brazil Calcium Ammonium Nitrate (CAN) Market Outlook, 2022-2032
- Market Size & Outlook
- By Revenues (USD Million)
- Market Share & Outlook
- By Form- Market Size & Forecast 2022-2032, USD Million
- By Application Method- Market Size & Forecast 2022-2032, USD Million
- By Crop Type- Market Size & Forecast 2022-2032, USD Million
- By Region - Market Size & Forecast 2022-2032, USD Million
- Market Size & Outlook
- Brazil Urea Ammonium Nitrate (UAN) Market Outlook, 2022-2032
- Market Size & Outlook
- By Revenues (USD Million)
- Market Share & Outlook
- By Form- Market Size & Forecast 2022-2032, USD Million
- By Application Method- Market Size & Forecast 2022-2032, USD Million
- By Crop Type- Market Size & Forecast 2022-2032, USD Million
- By Region - Market Size & Forecast 2022-2032, USD Million
- Market Size & Outlook
- Brazil Anhydrous Ammonia Market Outlook, 2022-2032
- Market Size & Outlook
- By Revenues (USD Million)
- Market Share & Outlook
- By Form- Market Size & Forecast 2022-2032, USD Million
- By Application Method- Market Size & Forecast 2022-2032, USD Million
- By Crop Type- Market Size & Forecast 2022-2032, USD Million
- By Region - Market Size & Forecast 2022-2032, USD Million
- Market Size & Outlook
- Brazil Aqua Ammonia Market Outlook, 2022-2032
- Market Size & Outlook
- By Revenues (USD Million)
- Market Share & Outlook
- By Form- Market Size & Forecast 2022-2032, USD Million
- By Application Method- Market Size & Forecast 2022-2032, USD Million
- By Crop Type- Market Size & Forecast 2022-2032, USD Million
- By Region - Market Size & Forecast 2022-2032, USD Million
- Market Size & Outlook
- Brazil Ammonium Chloride Market Outlook, 2022-2032
- Market Size & Outlook
- By Revenues (USD Million)
- Market Share & Outlook
- By Form- Market Size & Forecast 2022-2032, USD Million
- By Application Method- Market Size & Forecast 2022-2032, USD Million
- By Crop Type- Market Size & Forecast 2022-2032, USD Million
- By Region - Market Size & Forecast 2022-2032, USD Million
- Market Size & Outlook
- Brazil Nitrogenous Fertilizers Market Key Strategic Imperatives for Success & Growth
- Competitive Outlook
- Company Profiles
- Yara Brasil Fertilizantes
- Business Description
- Product Portfolio
- Collaborations & Alliances
- Recent Developments
- Financial Details
- Others
- The Mosaic Company
- Business Description
- Product Portfolio
- Collaborations & Alliances
- Recent Developments
- Financial Details
- Others
- EuroChem Fertilizantes Tocantins
- Business Description
- Product Portfolio
- Collaborations & Alliances
- Recent Developments
- Financial Details
- Others
- Petrobras
- Business Description
- Product Portfolio
- Collaborations & Alliances
- Recent Developments
- Financial Details
- Others
- Unigel
- Business Description
- Product Portfolio
- Collaborations & Alliances
- Recent Developments
- Financial Details
- Others
- Fertipar Fertilizantes
- Business Description
- Product Portfolio
- Collaborations & Alliances
- Recent Developments
- Financial Details
- Others
- Cibra Fertilizantes
- Business Description
- Product Portfolio
- Collaborations & Alliances
- Recent Developments
- Financial Details
- Others
- Fertilizantes Heringer
- Business Description
- Product Portfolio
- Collaborations & Alliances
- Recent Developments
- Financial Details
- Others
- Timac Agro Brasil
- Business Description
- Product Portfolio
- Collaborations & Alliances
- Recent Developments
- Financial Details
- Others
- Others
- Business Description
- Product Portfolio
- Collaborations & Alliances
- Recent Developments
- Financial Details
- Others
- Yara Brasil Fertilizantes
- Company Profiles
- Disclaimer

MarkNtel Advisors follows a robust and iterative research methodology designed to ensure maximum accuracy and minimize deviation in market estimates and forecasts. Our approach combines both bottom-up and top-down techniques to effectively segment and quantify various aspects of the market. A consistent feature across all our research reports is data triangulation, which examines the market from three distinct perspectives to validate findings. Key components of our research process include:
1. Scope & Research Design At the outset, MarkNtel Advisors define the research objectives and formulate pertinent questions. This phase involves determining the type of research—qualitative or quantitative—and designing a methodology that outlines data collection methods, target demographics, and analytical tools. They also establish timelines and budgets to ensure the research aligns with client goals.
2. Sample Selection and Data Collection In this stage, the firm identifies the target audience and determines the appropriate sample size to ensure representativeness. They employ various sampling methods, such as random or stratified sampling, based on the research objectives. Data collection is carried out using tools like surveys, interviews, and observations, ensuring the gathered data is reliable and relevant.
3. Data Analysis and Validation Once data is collected, MarkNtel Advisors undertake a rigorous analysis process. This includes cleaning the data to remove inconsistencies, employing statistical software for quantitative analysis, and thematic analysis for qualitative data. Validation steps are taken to ensure the accuracy and reliability of the findings, minimizing biases and errors.

4. Data Forecast and FinalizationThe final phase involves forecasting future market trends based on the analyzed data. MarkNtel Advisors utilize predictive modeling and time series analysis to anticipate market behaviors. The insights are then compiled into comprehensive reports, featuring visual aids like charts and graphs, and include strategic recommendations to inform client decision-making
We’d love to understand what matters most to you.