
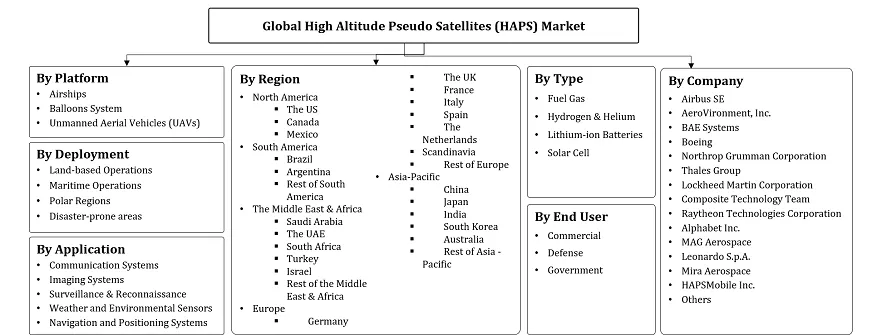
HAP Satellites Market Size - By Platform (Airships, Balloons System, Unmanned Aerial Vehicles (UAVs]), By Application (Communication Systems, Imaging Systems , Surveillance & Recon......onnaissance, Weather and Environmental Sensors, Navigation and Positioning Systems), By Deployment (Land-based Operations, Maritime Operations, Polar Regions, Disaster-Prone Areas), By Type (Fuel Gas, Hydrogen & Helium, Lithium-ion Batteries, Solar Cell), By End User (Commercial, Defense - Sized Enterprises, Government) and others Read more
- Aerospace & Defense
- Mar 2025
- 191
- PDF, Excel, PPT
Market Definition
High-altitude pseudo satellites, or HAPS, are unmanned air vehicles that can hold a fixed position. They could be airplanes, airships, or balloons. HAPS operates in the stratosphere, closer to Earth than many satellites but further up than drones and conventional aircraft. They offer continuous coverage and flexibility.
Market Insights & Analysis: Global High Altitude Pseudo Satellites (HAPS) Market (2025-30):
The Global High Altitude Pseudo Satellites (HAPS) Market size was valued at around USD 99 million in 2024 and is projected to reach USD 240 million by 2030. Along with this, the market is estimated to grow at a CAGR of around 16% during the forecast period, i.e., 2025-30. Due to its wide range of industrial applications the High Altitude Pseudo Satellites (HAPS) market is growing quickly on a global scale. The need for ongoing reasonably priced surveillance and reconnaissance systems especially in the defense industry is one of the main motivators. HAPS offers real-time threat monitoring and border security solutions as an alternative to costly satellite systems. HAPS is positioned as an essential tool for tracking natural disasters and lessening their effects which is in line with the growing interest in real-time environmental monitoring and disaster management. By using HAPS for precision farming, farmers can maximize resource use and keep an eye on crop health supporting sustainable agricultural practices.
| Report Coverage | Details |
|---|---|
| Historical Years | 2020-23 |
|
Base Years
|
2024
|
|
Forecast Years
|
2025-30
|
| Market Value in 2024 | USD 99 Million |
| Market Value in 2030 | USD 240 Million |
| CAGR (2025-30) | 16% |
| Leading Region | Asia-Pacific |
| Top Key Players | Airbus SE, AeroVironment, Inc., BAE Systems, Boeing, Northrop Grumman Corporation, Thales Group, Lockheed Martin Corporation, Composite Technology Team, Raytheon Technologies Corporation, Alphabet Inc., MAG Aerospace, Leonardo S.p.A., Mira Aerospace, HAPSMobile Inc., and others |
| Key Report Highlights |
|
*Boost strategic growth with in-depth market analysis - Get a free sample preview today!
As HAPS platforms expand internet coverage to underserved and remote areas, partnerships with telecom operators are also supporting the market. The use of HAPS for urban planning and traffic management in smart city projects further demonstrates its applicability. Pilot projects in India have shown notable gains in traffic flow and surveillance effectiveness by incorporating HAPS into smart city infrastructure.
Additionally, innovations in technology are crucial in determining the HAPS market. By combining AI and machine learning, autonomous operations are improved. With their versatility in communications surveillance and imaging applications, hybrid models that combine HAPS and satellite systems are becoming more popular. Furthermore, improved endurance and lower energy consumption are guaranteed by the development of ultra-lightweight materials for HAPS construction. Carbon fiber composites are the standard materials in use in HTA HAPS, balloons use polyethylene plastic, while airships use the hull of laminate material with a reinforcing fiber layer for the same.
- Market Segmentation
- Introduction
- Product Definition
- Research Process
- Assumptions
- Executive Summary
- Global High Altitude Pseudo Satellites (HAPS) Market Regulations and Policy
- Global High Altitude Pseudo Satellites (HAPS) Market Trends & Developments
- Global High Altitude Pseudo Satellites (HAPS) Market Supply Chain Analysis
- Global High Altitude Pseudo Satellites (HAPS) Market Dynamics
- Drivers
- Challenges
- Global High Altitude Pseudo Satellites (HAPS) Market & Opportunities
- Global High Altitude Pseudo Satellites (HAPS) Market Outlook, 2020-2030F
- Market Size & Analysis
- By Revenues (USD Million)
- Market Share & Analysis
- By Platform
- Airships – Market Size & Forecast 2020-2030, (USD Million)
- Balloons System – Market Size & Forecast 2020-2030, (USD Million)
- Unmanned Aerial Vehicles (UAVs) – Market Size & Forecast 2020-2030, (USD Million)
- By Application
- Communication Systems – Market Size & Forecast 2020-2030, (USD Million)
- Imaging Systems – Market Size & Forecast 2020-2030, (USD Million)
- Surveillance & Reconnaissance – Market Size & Forecast 2020-2030, (USD Million)
- Weather and Environmental Sensors – Market Size & Forecast 2020-2030, (USD Million)
- Navigation and Positioning Systems – Market Size & Forecast 2020-2030, (USD Million)
- By Deployment
- Land-based Operations – Market Size & Forecast 2020-2030, (USD Million)
- Maritime Operations – Market Size & Forecast 2020-2030, (USD Million)
- Polar Regions – Market Size & Forecast 2020-2030, (USD Million)
- Disaster-Prone Areas – Market Size & Forecast 2020-2030, (USD Million)
- By Type
- Fuel Gas – Market Size & Forecast 2020-2030, (USD Million)
- Hydrogen & Helium – Market Size & Forecast 2020-2030, (USD Million)
- Lithium-ion Batteries – Market Size & Forecast 2020-2030, (USD Million)
- Solar Cell – Market Size & Forecast 2020-2030, (USD Million)
- By End User
- Commercial – Market Size & Forecast 2020-2030, (USD Million)
- Defense - Sized Enterprises – Market Size & Forecast 2020-2030, (USD Million)
- Government – Market Size & Forecast 2020-2030, (USD Million)
- By Region
- North America
- South America
- Europe
- The Middle East & Africa
- Asia-Pacific
- By Company
- Market Share
- Competition Characteristics
- By Platform
- Market Size & Analysis
- North America High Altitude Pseudo Satellites (HAPS) Market Outlook, 2020-2030F
- Market Size & Analysis
- By Revenues (USD Million)
- Market Share & Analysis
- By Platform – Market Size & Forecast 2020-2030, (USD Million)
- By Application – Market Size & Forecast 2020-2030, (USD Million)
- By Deployment – Market Size & Forecast 2020-2030, (USD Million)
- By Type – Market Size & Forecast 2020-2030, (USD Million)
- By End User – Market Size & Forecast 2020-2030, (USD Million)
- By Country
- The US
- Canada
- Mexico
- The US High Altitude Pseudo Satellites (HAPS) Market Outlook, 2020-2030F
- Market Size & Analysis
- By Revenues (USD Million)
- Market Share & Analysis
- By Platform – Market Size & Forecast 2020-2030, (USD Million)
- By Application– Market Size & Forecast 2020-2030, (USD Million)
- By Deployment – Market Size & Forecast 2020-2030, (USD Million)
- By Type– Market Size & Forecast 2020-2030, (USD Million)
- By End User – Market Size & Forecast 2020-2030, (USD Million)
- Market Size & Analysis
- Canada High Altitude Pseudo Satellites (HAPS) Market Outlook, 2020-2030F
- Market Size & Analysis
- By Revenues (USD Million)
- Market Share & Analysis
- By Platform– Market Size & Forecast 2020-2030, (USD Million)
- By Application – Market Size & Forecast 2020-2030, (USD Million)
- By Deployment – Market Size & Forecast 2020-2030, (USD Million)
- By Type – Market Size & Forecast 2020-2030, (USD Million)
- By End User – Market Size & Forecast 2020-2030, (USD Million)
- Market Size & Analysis
- Mexico High Altitude Pseudo Satellites (HAPS) Market Outlook, 2020-2030
- Market Size & Analysis
- By Revenues (USD Million)
- Market Share & Analysis
- By Platform– Market Size & Forecast 2020-2030, (USD Million)
- By Application– Market Size & Forecast 2020-2030, (USD Million)
- By Deployment – Market Size & Forecast 2020-2030, (USD Million)
- By Type– Market Size & Forecast 2020-2030, (USD Million)
- By End User – Market Size & Forecast 2020-2030, (USD Million)
- Market Size & Analysis
- Market Size & Analysis
- South America High Altitude Pseudo Satellites (HAPS) Market Outlook, 2020-2030F
- Market Size & Analysis
- By Revenues (USD Million)
- Market Share & Analysis
- By Platform – Market Size & Forecast 2020-2030, (USD Million)
- By Application – Market Size & Forecast 2020-2030, (USD Million)
- By Deployment – Market Size & Forecast 2020-2030, (USD Million)
- By Type – Market Size & Forecast 2020-2030, (USD Million)
- By End User – Market Size & Forecast 2020-2030, (USD Million)
- By Country
- Brazil
- Argentina
- Rest of South America
- Brazil High Altitude Pseudo Satellites (HAPS) Market Outlook, 2020-2030F
- Market Size & Analysis
- By Revenues (USD Million)
- Market Share & Analysis
- By Platform– Market Size & Forecast 2020-2030, (USD Million)
- By Application– Market Size & Forecast 2020-2030, (USD Million)
- By Deployment– Market Size & Forecast 2020-2030, (USD Million)
- By Type – Market Size & Forecast 2020-2030, (USD Million)
- By End User- Market Size & Forecast 2020-2030, (USD Million)
- Market Size & Analysis
- Argentina High Altitude Pseudo Satellites (HAPS) Market Outlook, 2020-2030F
- Market Size & Analysis
- By Revenues (USD Million)
- Market Share & Analysis
- By Platform– Market Size & Forecast 2020-2030, (USD Million)
- By Application – Market Size & Forecast 2020-2030, (USD Million)
- By Deployment – Market Size & Forecast 2020-2030, (USD Million)
- By Type – Market Size & Forecast 2020-2030, (USD Million)
- By End User-Market Size & Forecast 2020-2030, (USD Million)
- Market Size & Analysis
- Market Size & Analysis
- Europe High Altitude Pseudo Satellites (HAPS) Market Outlook, 2020-2030F
- Market Size & Analysis
- By Revenues (USD Million)
- Market Share & Analysis
- By Platform – Market Size & Forecast 2020-2030, (USD Million)
- By Application – Market Size & Forecast 2020-2030, (USD Million)
- By Deployment – Market Size & Forecast 2020-2030, (USD Million)
- By Type – Market Size & Forecast 2020-2030, (USD Million)
- By End User – Market Size & Forecast 2020-2030, (USD Million)
- By Country
- Germany
- The UK
- France
- Italy
- Spain
- The Netherlands
- Scandinavia
- Rest of Europe
- Germany High Altitude Pseudo Satellites (HAPS) Market Outlook, 2020-2030F
- Market Size & Analysis
- By Revenues (USD Million)
- Market Share & Analysis
- By Platform – Market Size & Forecast 2020-2030, (USD Million)
- By Application – Market Size & Forecast 2020-2030, (USD Million)
- By Deployment – Market Size & Forecast 2020-2030, (USD Million)
- By Type – Market Size & Forecast 2020-2030, (USD Million)
- By End User – Market Size & Forecast 2020-2030, (USD Million)
- Market Size & Analysis
- The UK High Altitude Pseudo Satellites (HAPS) Market Outlook, 2020-2030F
- Market Size & Analysis
- By Revenues (USD Million)
- Market Share & Analysis
- By Platform – Market Size & Forecast 2020-2030, (USD Million)
- By Application – Market Size & Forecast 2020-2030, (USD Million)
- By Deployment – Market Size & Forecast 2020-2030, (USD Million)
- By Type – Market Size & Forecast 2020-2030, (USD Million)
- By End User – Market Size & Forecast 2020-2030, (USD Million)
- Market Size & Analysis
- France High Altitude Pseudo Satellites (HAPS) Market Outlook, 2020-2030
- Market Size & Analysis
- By Revenues (USD Million)
- Market Share & Analysis
- By Platform – Market Size & Forecast 2020-2030, (USD Million)
- By Application – Market Size & Forecast 2020-2030, (USD Million)
- By Deployment – Market Size & Forecast 2020-2030, (USD Million)
- By Type – Market Size & Forecast 2020-2030, (USD Million)
- By End User – Market Size & Forecast 2020-2030, (USD Million)
- Market Size & Analysis
- Italy High Altitude Pseudo Satellites (HAPS) Market Outlook, 2020-2030F
- Market Size & Analysis
- By Revenues (USD Million)
- Market Share & Analysis
- By Platform – Market Size & Forecast 2020-2030, (USD Million)
- By Application – Market Size & Forecast 2020-2030, (USD Million)
- By Deployment – Market Size & Forecast 2020-2030, (USD Million)
- By Type – Market Size & Forecast 2020-2030, (USD Million)
- By End User – Market Size & Forecast 2020-2030, (USD Million)
- Market Size & Analysis
- Spain High Altitude Pseudo Satellites (HAPS) Market Outlook, 2020-2030F
- Market Size & Analysis
- By Revenues (USD Million)
- Market Share & Analysis
- By Platform – Market Size & Forecast 2020-2030, (USD Million)
- By Application – Market Size & Forecast 2020-2030, (USD Million)
- By Deployment – Market Size & Forecast 2020-2030, (USD Million)
- By Type – Market Size & Forecast 2020-2030, (USD Million)
- By End User – Market Size & Forecast 2020-2030, (USD Million)
- Market Size & Analysis
- The Netherlands High Altitude Pseudo Satellites (HAPS) Market Outlook, 2020-2030F
- Market Size & Analysis
- By Revenues (USD Million)
- Market Share & Analysis
- By Platform – Market Size & Forecast 2020-2030, (USD Million)
- By Application – Market Size & Forecast 2020-2030, (USD Million)
- By Deployment – Market Size & Forecast 2020-2030, (USD Million)
- By Type – Market Size & Forecast 2020-2030, (USD Million)
- By End User – Market Size & Forecast 2020-2030, (USD Million)
- Market Size & Analysis
- Scandinavia High Altitude Pseudo Satellites (HAPS) Market Outlook, 2020-2030F
- Market Size & Analysis
- By Revenues (USD Million)
- Market Share & Analysis
- By Platform – Market Size & Forecast 2020-2030, (USD Million)
- By Application – Market Size & Forecast 2020-2030, (USD Million)
- By Deployment – Market Size & Forecast 2020-2030, (USD Million)
- By Type – Market Size & Forecast 2020-2030, (USD Million)
- By End User – Market Size & Forecast 2020-2030, (USD Million)
- Market Size & Analysis
- Market Size & Analysis
- The Middle East & Africa High Altitude Pseudo Satellites (HAPS) Market Outlook, 2020-2030F
- Market Size & Analysis
- By Revenues (USD Million)
- Market Share & Analysis
- By Platform – Market Size & Forecast 2020-2030, (USD Million)
- By Application – Market Size & Forecast 2020-2030, (USD Million)
- By Deployment – Market Size & Forecast 2020-2030, (USD Million)
- By Type – Market Size & Forecast 2020-2030, (USD Million)
- By End User – Market Size & Forecast 2020-2030, (USD Million)
- By Country
- Saudi Arabia
- The UAE
- South Africa
- Turkey
- Israel
- Rest of the Middle East & Africa
- Saudi Arabia High Altitude Pseudo Satellites (HAPS) Market Outlook, 2020-2030F
- Market Size & Analysis
- By Revenues (USD Million)
- Market Share & Analysis
- By Platform – Market Size & Forecast 2020-2030, (USD Million)
- By Application – Market Size & Forecast 2020-2030, (USD Million)
- By Deployment – Market Size & Forecast 2020-2030, (USD Million)
- By Type – Market Size & Forecast 2020-2030, (USD Million)
- By End User – Market Size & Forecast 2020-2030, (USD Million)
- Market Size & Analysis
- UAE High Altitude Pseudo Satellites (HAPS) Market Outlook, 2020-2030F
- Market Size & Analysis
- By Revenues (USD Million)
- Market Share & Analysis
- By Platform – Market Size & Forecast 2020-2030, (USD Million)
- By Application – Market Size & Forecast 2020-2030, (USD Million)
- By Deployment – Market Size & Forecast 2020-2030, (USD Million)
- By Type – Market Size & Forecast 2020-2030, (USD Million)
- By End User – Market Size & Forecast 2020-2030, (USD Million)
- Market Size & Analysis
- South Africa High Altitude Pseudo Satellites (HAPS) Market Outlook, 2020-2030
- Market Size & Analysis
- By Revenues (USD Million)
- Market Share & Analysis
- By Platform – Market Size & Forecast 2020-2030, (USD Million)
- By Application – Market Size & Forecast 2020-2030, (USD Million)
- By Deployment – Market Size & Forecast 2020-2030, (USD Million)
- By Type – Market Size & Forecast 2020-2030, (USD Million)
- By End User – Market Size & Forecast 2020-2030, (USD Million)
- Market Size & Analysis
- Turkey High Altitude Pseudo Satellites (HAPS) Market Outlook, 2020-2030
- Market Size & Analysis
- By Revenues (USD Million)
- Market Share & Analysis
- By Platform – Market Size & Forecast 2020-2030, (USD Million)
- By Application – Market Size & Forecast 2020-2030, (USD Million)
- By Deployment – Market Size & Forecast 2020-2030, (USD Million)
- By Type – Market Size & Forecast 2020-2030, (USD Million)
- By End User – Market Size & Forecast 2020-2030, (USD Million)
- Market Size & Analysis
- Israel High Altitude Pseudo Satellites (HAPS) Market Outlook, 2020-2030
- Market Size & Analysis
- By Revenues (USD Million)
- Market Share & Analysis
- By Platform – Market Size & Forecast 2020-2030, (USD Million)
- By Application – Market Size & Forecast 2020-2030, (USD Million)
- By Deployment – Market Size & Forecast 2020-2030, (USD Million)
- By Type – Market Size & Forecast 2020-2030, (USD Million)
- By End User – Market Size & Forecast 2020-2030, (USD Million)
- Market Size & Analysis
- Market Size & Analysis
- Asia Pacific High Altitude Pseudo Satellites (HAPS) Market Outlook, 2020-2030F
- Market Size & Analysis
- By Revenues (USD Million)
- Market Share & Analysis
- By Platform – Market Size & Forecast 2020-2030, (USD Million)
- By Application – Market Size & Forecast 2020-2030, (USD Million)
- By Deployment – Market Size & Forecast 2020-2030, (USD Million)
- By Type – Market Size & Forecast 2020-2030, (USD Million)
- By End User – Market Size & Forecast 2020-2030, (USD Million)
- By Country
- China
- Japan
- India
- South Korea
- Australia
- Rest of Asia Pacific
- China High Altitude Pseudo Satellites (HAPS) Market Outlook, 2020-2030F
- Market Size & Analysis
- By Revenues (USD Million)
- Market Share & Analysis
- By Platform – Market Size & Forecast 2020-2030, (USD Million)
- By Application – Market Size & Forecast 2020-2030, (USD Million)
- By Deployment – Market Size & Forecast 2020-2030, (USD Million)
- By Type – Market Size & Forecast 2020-2030, (USD Million)
- By End User – Market Size & Forecast 2020-2030, (USD Million)
- Market Size & Analysis
- Japan High Altitude Pseudo Satellites (HAPS) Market Outlook, 2020-2030F
- Market Size & Analysis
- By Revenues (USD Million)
- Market Share & Analysis
- By Platform – Market Size & Forecast 2020-2030, (USD Million)
- By Application – Market Size & Forecast 2020-2030, (USD Million)
- By Deployment – Market Size & Forecast 2020-2030, (USD Million)
- By Type – Market Size & Forecast 2020-2030, (USD Million)
- By End User – Market Size & Forecast 2020-2030, (USD Million)
- Market Size & Analysis
- India High Altitude Pseudo Satellites (HAPS) Market Outlook, 2020-2030
- Market Size & Analysis
- By Revenues (USD Million)
- Market Share & Analysis
- By Platform – Market Size & Forecast 2020-2030, (USD Million)
- By Application – Market Size & Forecast 2020-2030, (USD Million)
- By Deployment – Market Size & Forecast 2020-2030, (USD Million)
- By Type – Market Size & Forecast 2020-2030, (USD Million)
- By End User – Market Size & Forecast 2020-2030, (USD Million)
- Market Size & Analysis
- South Korea High Altitude Pseudo Satellites (HAPS) Market Outlook, 2020-2030
- Market Size & Analysis
- By Revenues (USD Million)
- Market Share & Analysis
- By Platform – Market Size & Forecast 2020-2030, (USD Million)
- By Application – Market Size & Forecast 2020-2030, (USD Million)
- By Deployment – Market Size & Forecast 2020-2030, (USD Million)
- By Type – Market Size & Forecast 2020-2030, (USD Million)
- By End User – Market Size & Forecast 2020-2030, (USD Million)
- Market Size & Analysis
- Australia High Altitude Pseudo Satellites (HAPS) Market Outlook, 2020-2030
- Market Size & Analysis
- By Revenues (USD Million)
- Market Share & Analysis
- By Platform – Market Size & Forecast 2020-2030, (USD Million)
- By Application – Market Size & Forecast 2020-2030, (USD Million)
- By Deployment – Market Size & Forecast 2020-2030, (USD Million)
- By Type – Market Size & Forecast 2020-2030, (USD Million)
- By End User – Market Size & Forecast 2020-2030, (USD Million)
- Market Size & Analysis
- Market Size & Analysis
- Competitive Outlook
- Company Profiles
- Airbus SE
- Business Description
- Product Portfolio
- Strategic Alliances or Partnerships
- Recent Developments
- Financial Details
- Others
- AeroVironment, Inc.
- Business Description
- Product Portfolio
- Strategic Alliances or Partnerships
- Recent Developments
- Financial Details
- Others
- BAE Systems
- Business Description
- Product Portfolio
- Strategic Alliances or Partnerships
- Recent Developments
- Financial Details
- Others
- Boeing
- Business Description
- Product Portfolio
- Strategic Alliances or Partnerships
- Recent Developments
- Financial Details
- Others
- Northrop Grumman Corporation
- Business Description
- Product Portfolio
- Strategic Alliances or Partnerships
- Recent Developments
- Financial Details
- Others
- Thales Group
- Business Description
- Product Portfolio
- Strategic Alliances or Partnerships
- Recent Developments
- Financial Details
- Others
- Lockheed Martin Corporation
- Business Description
- Product Portfolio
- Strategic Alliances or Partnerships
- Recent Developments
- Financial Details
- Others
- Composite Technology Team
- Business Description
- Product Portfolio
- Strategic Alliances or Partnerships
- Recent Developments
- Financial Details
- Others
- Raytheon Technologies Corporation
- Business Description
- Product Portfolio
- Strategic Alliances or Partnerships
- Recent Developments
- Financial Details
- Others
- Alphabet Inc.
- Business Description
- Product Portfolio
- Strategic Alliances or Partnerships
- Recent Developments
- Financial Details
- Others
- MAG Aerospace
- Business Description
- Product Portfolio
- Strategic Alliances or Partnerships
- Recent Developments
- Financial Details
- Others
- Leonardo S.p.A.
- Business Description
- Product Portfolio
- Strategic Alliances or Partnerships
- Recent Developments
- Financial Details
- Others
- Mira Aerospace
- Business Description
- Product Portfolio
- Strategic Alliances or Partnerships
- Recent Developments
- Financial Details
- Others
- HAPSMobile Inc.
- Business Description
- Product Portfolio
- Strategic Alliances or Partnerships
- Recent Developments
- Financial Details
- Others
- Others
- Airbus SE
- Company Profiles
- Disclaimer
MarkNtel Advisors follows a robust and iterative research methodology designed to ensure maximum accuracy and minimize deviation in market estimates and forecasts. Our approach combines both bottom-up and top-down techniques to effectively segment and quantify various aspects of the market. A consistent feature across all our research reports is data triangulation, which examines the market from three distinct perspectives to validate findings. Key components of our research process include:
1. Scope & Research Design At the outset, MarkNtel Advisors define the research objectives and formulate pertinent questions. This phase involves determining the type of research—qualitative or quantitative—and designing a methodology that outlines data collection methods, target demographics, and analytical tools. They also establish timelines and budgets to ensure the research aligns with client goals.
2. Sample Selection and Data Collection In this stage, the firm identifies the target audience and determines the appropriate sample size to ensure representativeness. They employ various sampling methods, such as random or stratified sampling, based on the research objectives. Data collection is carried out using tools like surveys, interviews, and observations, ensuring the gathered data is reliable and relevant.
3. Data Analysis and Validation Once data is collected, MarkNtel Advisors undertake a rigorous analysis process. This includes cleaning the data to remove inconsistencies, employing statistical software for quantitative analysis, and thematic analysis for qualitative data. Validation steps are taken to ensure the accuracy and reliability of the findings, minimizing biases and errors.

4. Data Forecast and FinalizationThe final phase involves forecasting future market trends based on the analyzed data. MarkNtel Advisors utilize predictive modeling and time series analysis to anticipate market behaviors. The insights are then compiled into comprehensive reports, featuring visual aids like charts and graphs, and include strategic recommendations to inform client decision-making
FILL THE FORM TO INQUIRE BEFORE BUYING THIS REPORT
We offer flexible licensing options to cater to varying organizational needs. Choose the pricing pack that best suits your requirements:
Buy Now