
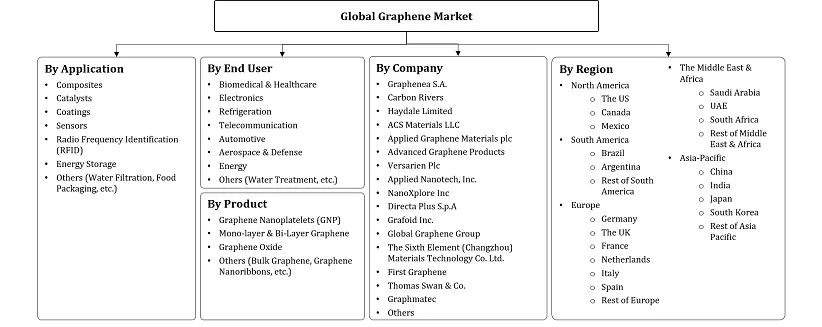
Graphene Market - By Product (Graphene Nanoplatelets [GNP], Mono-layer & Bi-Layer Graphene, Graphene Oxide, Others), By Application (Composites, Catalysts, Coatings, Sensors, Radio...... Frequency Identification [RFID], Energy Storage, Others), By End User (Biomedical & Healthcare, Electronics, Telecommunication, Automotive, Aerospace & Defense, Energy, Others) and others Read more
- Chemicals
- Feb 2024
- 232
- PDF, Excel, PPT
Market Definition
Graphene is a single layer of carbon atoms arranged in a hexagonal lattice, forming a two-dimensional honeycomb structure. It is a fundamental building block of other carbon allotropes, such as graphite, carbon nanotubes, and fullerenes. Graphene exhibits remarkable physical and electronic properties, making it a material of great scientific and technological interest.
Market Insights & Analysis: Global Graphene Market (2025-30):
The Global Graphene Market size is valued at around USD 419 million in 2024 & is projected to reach USD 1.78 billion by 2030. The market is also estimated to grow at a CAGR of around 33.55% during the forecast period, i.e., 2025-30. The surging demand from the automotive & aerospace industries, a rising need in the energy storage sector, and the expansion of research and development initiatives are driving market growth. Growing awareness of environmental issues, particularly air pollution and climate change, has led to increased interest in reducing the carbon footprint of transportation. As a result, governments worldwide are increasingly implementing policies aimed at reducing emissions from the transportation sector. Many governments, like the US, the UK, China, etc., are offering financial incentives, subsidies, and tax breaks to both consumers and manufacturers to promote the adoption of electric vehicles. These policy measures created a more favorable environment for the production and purchase of EVs in the past few years.
| Report Coverage | Details |
|---|---|
| Historical Years | 2020-23 |
|
Base Years
|
2024
|
|
Forecast Years
|
2025-30
|
| Market Value in 2024 | USD 419 Million |
| Market Value in 2030 | USD 1.78 Billion |
| CAGR (2025-30) | 33.55% |
| Leading Region | Asia-Pacific |
| Top Key Players | Graphenea S.A., Carbon Rivers, Haydale Limited, ACS Materials LLC, Applied Graphene Materials plc, Advanced Graphene Products, Versarien Plc, Applied Nanotech, Inc., NanoXplore Inc., Directa Plus S.p.A, Grafoid Inc., Global Graphene Group, The Sixth Element (Changzhou) Materials Technology Co. Ltd., First Graphene, Thomas Swan & Co., Graphmatec, and others |
| Key Report Highlights |
|
*Boost strategic growth with in-depth market analysis - Get a free sample preview today!
According to the International Energy Agency, in 2023, over 2.3 million electric cars were sold in the first quarter of 2023, a growth of approximately 25% compared to the corresponding period in 2022. This surge in demand for electric vehicles has led to the widespread adoption of graphene due to its unique properties, including conductivity and lightweight characteristics. Graphene is now recognized as a promising material for enhancing battery performance, further contributing to its increasing use and, consequently, the overall growth of the market.
Furthermore, the substantial surface area and excellent electrical conductivity of graphene position it as a viable material for energy storage devices like batteries and supercapacitors. The growing emphasis on sustainable energy solutions has generated interest in materials that could play a role in developing environmentally friendly energy storage devices. Graphene's capacity to improve the effectiveness and efficiency of batteries and supercapacitors aligns with the overarching objective of advancing sustainable and clean energy storage technologies, thereby propelling the adoption of graphene.
Moreover, governments worldwide recognize the potential of graphene and invest in research and development initiatives. For instance,
- In 2024, the Ministry of Electronics and Information Technology in India inaugurated the India Innovation Center for Graphene (IICG) in Kochi, Kerala. The project aims to promote research and development, encourage product innovation, and enhance capacity-building initiatives.
Thus, growing funding and support from governmental bodies could significantly boost the size & volume of the Graphene Market in the coming years.
- Market Segmentation
- Introduction
- Product Definition
- Research Process
- Assumptions
- Executive Summary
- Global Graphene Market Supply Chain Analysis
- Global Graphene Market Trends & Developments
- Global Graphene Market Dynamics
- Drivers
- Challenges
- Global Graphene Market Hotspot & Opportunities
- Global Graphene Market Regulations and Policy
- Global Graphene Market Outlook, 2020-2030F
- Market Size & Analysis
- Revenues (USD Million)
- By Volume (Kilo Tons)
- Market Size & Analysis
- By Product
- Graphene Nanoplatelets (GNP) - Market Size & Forecast 2020-2030, (Kilo Tons)
- Mono-layer & Bi-Layer Graphene- Market Size & Forecast 2020-2030, (Kilo Tons)
- Graphene Oxide- Market Size & Forecast 2020-2030, (Kilo Tons)
- Others (Bulk Graphene, Graphene Nanoribbons, etc.) - Market Size & Forecast 2020-2030, (Kilo Tons)
- By Application
- Composites- Market Size & Forecast 2020-2030, (Kilo Tons)
- Catalysts- Market Size & Forecast 2020-2030, (Kilo Tons)
- Coatings- Market Size & Forecast 2020-2030, (Kilo Tons)
- Sensors- Market Size & Forecast 2020-2030, (Kilo Tons)
- Radio Frequency Identification (RFID) - Market Size & Forecast 2020-2030, (Kilo Tons)
- Energy Storage- Market Size & Forecast 2020-2030, (Kilo Tons)
- Others (Water Filtration, Food Packaging, etc.)- Market Size & Forecast 2020-2030, (Kilo Tons)
- By End User
- Biomedical & Healthcare- Market Size & Forecast 2020-2030, (Kilo Tons)
- Electronics- Market Size & Forecast 2020-2030, (Kilo Tons)
- Telecommunication- Market Size & Forecast 2020-2030, (Kilo Tons)
- Automotive- Market Size & Forecast 2020-2030, (Kilo Tons)
- Aerospace & Defense- Market Size & Forecast 2020-2030, (Kilo Tons)
- Energy- Market Size & Forecast 2020-2030, (Kilo Tons) - Market Size & Forecast 2020-2030, (Kilo Tons)
- Others (Water Treatment, etc.) - Market Size & Forecast 2020-2030, (Kilo Tons)
- By Region
- North America
- South America
- Europe
- The Middle East & Africa
- Asia Pacific
- By Company
- Competition Characteristics
- Market Share & Analysis
- By Product
- Market Size & Analysis
- North America Graphene Market Outlook, 2020-2030F
- Market Size & Analysis
- Revenues (USD Million)
- By Volume (Kilo Tons)
- Market Size & Analysis
- By Product- Market Size & Forecast 2020-2030, (Kilo Tons)
- By Application- Market Size & Forecast 2020-2030, (Kilo Tons)
- By End Users- Market Size & Forecast 2020-2030, (Kilo Tons)
- By Country- Market Size & Forecast 2020-2030, (Kilo Tons)
- The US
- Canada
- Mexico
- The US Graphene Market Outlook, 2020-2030F
- Market Size & Analysis
- Revenues (USD Million)
- By Volume (Kilo Tons)
- Market Share & Analysis
- By Application- Market Size & Forecast 2020-2030, (Kilo Tons)
- By End Users- Market Size & Forecast 2020-2030, (Kilo Tons)
- Market Size & Analysis
- Canada Graphene Market Outlook, 2020-2030F
- Market Size & Analysis
- Revenues (USD Million)
- By Volume (Kilo Tons)
- Market Size & Analysis
- By Application- Market Size & Forecast 2020-2030, (Kilo Tons)
- By End Users- Market Size & Forecast 2020-2030, (Kilo Tons)
- Market Size & Analysis
- Mexico Graphene Market Outlook, 2020-2030F
- Market Size & Analysis
- Revenues (USD Million)
- By Volume (Kilo Tons)
- Market Size & Analysis
- By Application- Market Size & Forecast 2020-2030, (Kilo Tons)
- By End Users- Market Size & Forecast 2020-2030, (Kilo Tons)
- Market Size & Analysis
- Market Size & Analysis
- South America Graphene Market Outlook, 2020-2030F
- Market Size & Analysis
- Revenues (USD Million)
- By Volume (Kilo Tons)
- Market Size & Analysis
- By Product- Market Size & Forecast 2020-2030, (Kilo Tons)
- By Application- Market Size & Forecast 2020-2030, (Kilo Tons)
- By End Users- Market Size & Forecast 2020-2030, (Kilo Tons)
- By Country- Market Size & Forecast 2020-2030, (Kilo Tons)
- Brazil
- Argentina
- Rest of South America
- Brazil Graphene Market Outlook, 2020-2030F
- Market Size & Analysis
- Revenues (USD Million)
- By Volume (Kilo Tons)
- Market Size & Analysis
- By Application- Market Size & Forecast 2020-2030, (Kilo Tons)
- By End Users- Market Size & Forecast 2020-2030, (Kilo Tons)
- Market Size & Analysis
- Argentina Graphene Market Outlook, 2020-2030F
- Market Size & Analysis
- Revenues (USD Million)
- By Volume (Kilo Tons)
- Market Size & Analysis
- By Application- Market Size & Forecast 2020-2030, (Kilo Tons)
- By End Users- Market Size & Forecast 2020-2030, (Kilo Tons)
- Market Size & Analysis
- Market Size & Analysis
- Europe Graphene Market Outlook, 2020-2030F
- Market Size & Analysis
- Revenues (USD Million)
- By Volume (Kilo Tons)
- Market Size & Analysis
- By Product- Market Size & Forecast 2020-2030, (Kilo Tons)
- By Application- Market Size & Forecast 2020-2030, (Kilo Tons)
- By End Users- Market Size & Forecast 2020-2030, (Kilo Tons)
- By Country- Market Size & Forecast 2020-2030, (Kilo Tons)
- Germany
- The UK
- France
- Italy
- The Netherlands
- Spain
- Rest of Europe
- Germany Graphene Market Outlook, 2020-2030F
- Market Size & Analysis
- Revenues (USD Million)
- By Volume (Kilo Tons)
- Market Size & Analysis
- By Application- Market Size & Forecast 2020-2030, (Kilo Tons)
- By End Users- Market Size & Forecast 2020-2030, (Kilo Tons)
- Market Size & Analysis
- The UK Graphene Market Outlook, 2020-2030F
- Market Size & Analysis
- Revenues (USD Million)
- By Volume (Kilo Tons)
- Market Size & Analysis
- By Application- Market Size & Forecast 2020-2030, (Kilo Tons)
- By End Users- Market Size & Forecast 2020-2030, (Kilo Tons)
- Market Size & Analysis
- France Graphene Market Outlook, 2020-2030F
- Market Size & Analysis
- Revenues (USD Million)
- By Volume (Kilo Tons)
- Market Size & Analysis
- By Application- Market Size & Forecast 2020-2030, (Kilo Tons)
- By End Users- Market Size & Forecast 2020-2030, (Kilo Tons)
- Market Size & Analysis
- Italy Graphene Market Outlook, 2020-2030F
- Market Size & Analysis
- Revenues (USD Million)
- By Volume (Kilo Tons)
- Market Size & Analysis
- By Application- Market Size & Forecast 2020-2030, (Kilo Tons)
- By End Users- Market Size & Forecast 2020-2030, (Kilo Tons)
- Market Size & Analysis
- Spain Graphene Market Outlook, 2020-2030F
- Market Size & Analysis
- Revenues (USD Million)
- By Volume (Kilo Tons)
- Market Size & Analysis
- By Application- Market Size & Forecast 2020-2030, (Kilo Tons)
- By End Users- Market Size & Forecast 2020-2030, (Kilo Tons)
- Market Size & Analysis
- Market Size & Analysis
- Middle East & Africa Graphene Market Outlook, 2020-2030F
- Market Size & Analysis
- Revenues (USD Million)
- By Volume (Kilo Tons)
- Market Size & Analysis
- By Product- Market Size & Forecast 2020-2030, (Kilo Tons)
- By Application- Market Size & Forecast 2020-2030, (Kilo Tons)
- By End Users- Market Size & Forecast 2020-2030, (Kilo Tons)
- By Country- Market Size & Forecast 2020-2030, (Kilo Tons)
- Saudi Arabia
- The UAE
- South Africa
- Rest of the Middle East and Africa
- Saudi Arabia Graphene Market Outlook, 2020-2030F
- Market Size & Analysis
- Revenues (USD Million)
- By Volume (Kilo Tons)
- Market Size & Analysis
- By Application- Market Size & Forecast 2020-2030, (Kilo Tons)
- By End Users- Market Size & Forecast 2020-2030, (Kilo Tons)
- Market Size & Analysis
- The UAE Graphene Market Outlook, 2020-2030F
- Market Size & Analysis
- Revenues (USD Million)
- By Volume (Kilo Tons)
- Market Size & Analysis
- By Application- Market Size & Forecast 2020-2030, (Kilo Tons)
- By End Users- Market Size & Forecast 2020-2030, (Kilo Tons)
- Market Size & Analysis
- South Africa Graphene Market Outlook, 2020-2030F
- Market Size & Analysis
- Revenues (USD Million)
- By Volume (Kilo Tons)
- Market Size & Analysis
- By Application- Market Size & Forecast 2020-2030, (Kilo Tons)
- By End Users- Market Size & Forecast 2020-2030, (Kilo Tons)
- Market Size & Analysis
- Market Size & Analysis
- Asia-Pacific Graphene Market Outlook, 2020-2030F
- Market Size & Analysis
- Revenues (USD Million)
- By Volume (Kilo Tons)
- Market Size & Analysis
- By Product- Market Size & Forecast 2020-2030, (Kilo Tons)
- By Application- Market Size & Forecast 2020-2030, (Kilo Tons)
- By End Users- Market Size & Forecast 2020-2030, (Kilo Tons)
- By Country- Market Size & Forecast 2020-2030, (Kilo Tons)
- China
- India
- Japan
- South Korea
- Rest of Asia-Pacific
- China Graphene Market Outlook, 2020-2030F
- Market Size & Analysis
- Revenues (USD Million)
- By Volume (Kilo Tons)
- Market Size & Analysis
- By Application- Market Size & Forecast 2020-2030, (Kilo Tons)
- By End Users- Market Size & Forecast 2020-2030, (Kilo Tons)
- Market Size & Analysis
- India Graphene Market Outlook, 2020-2030F
- Market Size & Analysis
- Revenues (USD Million)
- By Volume (Kilo Tons)
- Market Size & Analysis
- By Application- Market Size & Forecast 2020-2030, (Kilo Tons)
- By End Users- Market Size & Forecast 2020-2030, (Kilo Tons)
- Market Size & Analysis
- Japan Graphene Market Outlook, 2020-2030F
- Market Size & Analysis
- Revenues (USD Million)
- By Volume (Kilo Tons)
- Market Size & Analysis
- By Application- Market Size & Forecast 2020-2030, (Kilo Tons)
- By End Users- Market Size & Forecast 2020-2030, (Kilo Tons)
- Market Size & Analysis
- South Korea Graphene Market Outlook, 2020-2030F
- Market Size & Analysis
- Revenues (USD Million)
- By Volume (Kilo Tons)
- Market Size & Analysis
- By Application- Market Size & Forecast 2020-2030, (Kilo Tons)
- By End Users- Market Size & Forecast 2020-2030, (Kilo Tons)
- Market Size & Analysis
- Market Size & Analysis
- Global Graphene Market Key Strategic Imperatives for Growth & Success
- Competition Outlook
- Graphenea S.A.
- Business Description
- Product Portfolio
- Strategic Alliances or Partnerships
- Recent Developments
- Financial Details
- Others
- Carbon Rivers
- Business Description
- Product Portfolio
- Strategic Alliances or Partnerships
- Recent Developments
- Financial Details
- Others
- Haydale Limited
- Business Description
- Product Portfolio
- Strategic Alliances or Partnerships
- Recent Developments
- Financial Details
- Others
- ACS Materials LLC
- Business Description
- Product Portfolio
- Strategic Alliances or Partnerships
- Recent Developments
- Financial Details
- Others
- Applied Graphene Materials plc
- Business Description
- Product Portfolio
- Strategic Alliances or Partnerships
- Recent Developments
- Financial Details
- Others
- Advanced Graphene Products
- Business Description
- Product Portfolio
- Strategic Alliances or Partnerships
- Recent Developments
- Financial Details
- Others
- Versarien Plc
- Business Description
- Product Portfolio
- Strategic Alliances or Partnerships
- Recent Developments
- Financial Details
- Others
- Applied Nanotech, Inc.
- Business Description
- Product Portfolio
- Strategic Alliances or Partnerships
- Recent Developments
- Financial Details
- Others
- NanoXplore Inc.
- Product Portfolio
- Strategic Alliances or Partnerships
- Recent Developments
- Financial Details
- Others
- Directa Plus S.p.A
- Product Portfolio
- Strategic Alliances or Partnerships
- Recent Developments
- Financial Details
- Others
- Grafoid Inc.
- Product Portfolio
- Strategic Alliances or Partnerships
- Recent Developments
- Financial Details
- Others
- Global Graphene Group
- Product Portfolio
- Strategic Alliances or Partnerships
- Recent Developments
- Financial Details
- Others
- The Sixth Element (Changzhou) Materials Technology Co. Ltd.
- Product Portfolio
- Strategic Alliances or Partnerships
- Recent Developments
- Financial Details
- Others
- First Graphene
- Product Portfolio
- Strategic Alliances or Partnerships
- Recent Developments
- Financial Details
- Others
- Thomas Swan & Co.
- Product Portfolio
- Strategic Alliances or Partnerships
- Recent Developments
- Financial Details
- Others
- Graphmatec
- Product Portfolio
- Strategic Alliances or Partnerships
- Recent Developments
- Financial Details
- Others
- Others
- Graphenea S.A.
- Disclaimer
MarkNtel Advisors follows a robust and iterative research methodology designed to ensure maximum accuracy and minimize deviation in market estimates and forecasts. Our approach combines both bottom-up and top-down techniques to effectively segment and quantify various aspects of the market. A consistent feature across all our research reports is data triangulation, which examines the market from three distinct perspectives to validate findings. Key components of our research process include:
1. Scope & Research Design At the outset, MarkNtel Advisors define the research objectives and formulate pertinent questions. This phase involves determining the type of research—qualitative or quantitative—and designing a methodology that outlines data collection methods, target demographics, and analytical tools. They also establish timelines and budgets to ensure the research aligns with client goals.
2. Sample Selection and Data Collection In this stage, the firm identifies the target audience and determines the appropriate sample size to ensure representativeness. They employ various sampling methods, such as random or stratified sampling, based on the research objectives. Data collection is carried out using tools like surveys, interviews, and observations, ensuring the gathered data is reliable and relevant.
3. Data Analysis and Validation Once data is collected, MarkNtel Advisors undertake a rigorous analysis process. This includes cleaning the data to remove inconsistencies, employing statistical software for quantitative analysis, and thematic analysis for qualitative data. Validation steps are taken to ensure the accuracy and reliability of the findings, minimizing biases and errors.

4. Data Forecast and FinalizationThe final phase involves forecasting future market trends based on the analyzed data. MarkNtel Advisors utilize predictive modeling and time series analysis to anticipate market behaviors. The insights are then compiled into comprehensive reports, featuring visual aids like charts and graphs, and include strategic recommendations to inform client decision-making
FILL THE FORM TO INQUIRE BEFORE BUYING THIS REPORT
We offer flexible licensing options to cater to varying organizational needs. Choose the pricing pack that best suits your requirements:
Buy Now