Re-Commerce Market Research Report: Forecast (2026-2032)
By Type (Peer-to-Peer Marketplaces, Resale Marketplaces, Refurbished Goods Marketplaces), By Product (Electronics (Smartphones & Tablets, Laptops & Computers, Cameras and Photograp ... hy Equipment, Home Appliances (Refurbished Refrigerators, Washing Machines, etc.), Others (Networking Equipment, Gaming Consoles and Accessories, etc.)), Fashion & Apparel (Clothing, Footwear, Accessories (Jewelry, Watches, Handbags, etc.)), Furniture and Home Goods (Sofas and Couches, Tables & Chairs, Home Decor (Rugs, Paintings, Vases, etc.), Others (Garden Equipment, Bathroom Accessories, etc.)), Automotive (Used Vehicles, Vehicle Parts and Accessories), Sports and Fitness Equipment, Others (Toys, Collectibles, Books, etc.)), By Product Category (Non-Luxury, Luxury), By Age Group (Up to 18 Years, 19-25 Years, 26-40 Years, 41-55 Years, Above 56 Years), and others Read more
- ICT & Electronics
- Aug 2026
- Pages 345
- Report Format: PDF, Excel, PPT
Re-Commerce Market
Projected 6.99% CAGR from 2026 to 2032
Study Period
2026-2032
Market Size (2026)
USD 236 Billion
Market Size (2032)
USD 354 Billion
Largest Region
North America
Projected CAGR
6.99%
Leading Segments
By Type: Peer-to-Peer Marketplaces
Re-Commerce Market Key Takeaways
- The global re-commerce market size was valued at USD 213 billion in 2025 and is projected to grow from USD 236 billion in 2026 to USD 354 billion by 2032.
- The industry is projected to sustain growth at a steady CAGR of 6.99% during 2026-2032.
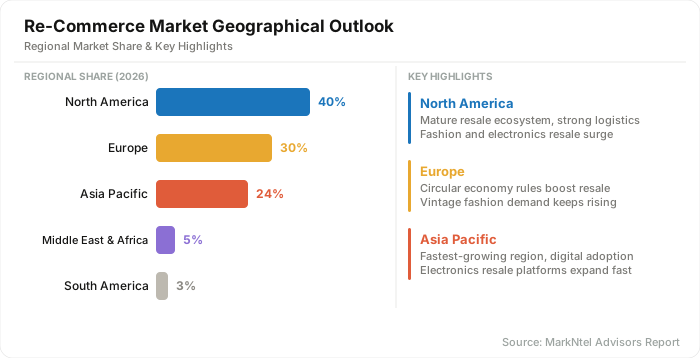
- North America holds the largest share of about 40% in 2026.
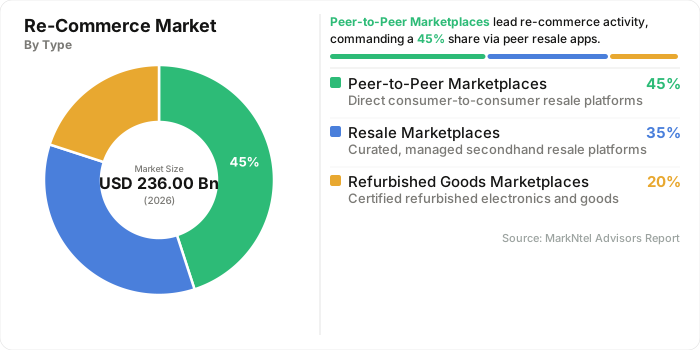
- By type, Peer-to-Peer (P2P) marketplaces hold a significant share of about 45% in 2026.
- By product category, non-luxury seized a significant share of about 80% in 2026.
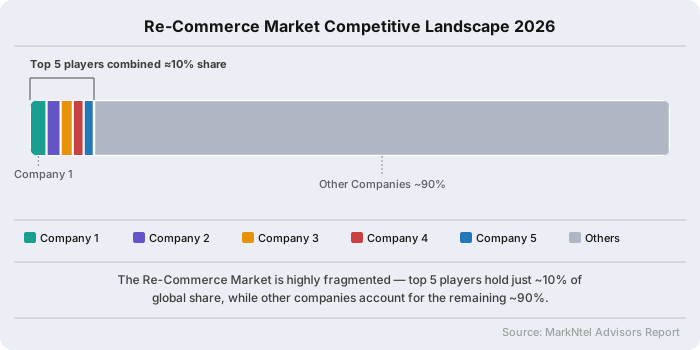
- The industry is highly fragmented. However, the top five players collectively account for nearly a 10% share.
Re-Commerce Market Size and Outlook
The global re-commerce market size was valued at USD 213 billion in 2025 and is projected to grow from USD 236 billion in 2026 to USD 354 billion by 2032. Along with this, the market is estimated to grow at a CAGR of around 6.99% during the forecast period, i.e., 2026-32.
The market is transitioning from a niche resale activity into an increasingly mainstream component of modern retail, supported by affordability, digital commerce, changing consumer preferences, and sustainability considerations. Demand is particularly strong among younger consumers, with 68% of Gen Z and Millennials purchasing second-hand apparel in 2024, compared with 32% of consumers aged 38–55 and 16% of those aged 56–65. Furthermore, 83% of Gen Z consumers have either purchased or shown strong interest in second-hand goods, highlighting the growing normalization of pre-owned consumption.
Digital channels are further accelerating this transformation. Online resale of second-hand apparel is projected to reach USD 40 billion by 2029, reflecting the increasing importance of digital marketplaces, e-commerce platforms, and brand-owned resale channels. These platforms improve product discovery, expand geographic access, and allow consumers to compare prices and product conditions more conveniently. The broader consumer base is also becoming increasingly receptive to re-commerce, with 93% of Americans participating in second-hand purchasing in 2025.
Consequently, re-commerce is gaining strategic importance for retailers and brands, which are increasingly introducing trade-in, resale, refurbishment, and take-back programs. As digital infrastructure, logistics, authentication, and organized resale channels continue to improve, the market is expected to benefit from wider consumer adoption and greater participation across fashion, electronics, luxury goods, furniture, and other product categories.
Re-Commerce Market Key Indicators
- Year-on-year growth measures how quickly re-commerce activity is expanding compared with the previous year. eBay’s 2025 Re-commerce Report found that 89% of surveyed global consumers expected to maintain or increase their spending on pre-loved products compared with 2024. In the refurbished-device segment, Re-commerce’s 2026 Trade-In Index reported that the average European smartphone trade-in value increased from approximately USD 193 in 2025 to USD 215 in 2026, representing a rise of more than 10%. These indicators demonstrate continuing demand expansion across the re-commerce ecosystem.
- Academic life-cycle assessment research indicates that re-commerce can generate measurable environmental benefits beyond its economic value. Reusing 1 kilogram of clothing can avoid approximately 25 kilograms of CO₂ emissions, while doubling the average lifespan of a garment may reduce fashion-industry greenhouse-gas emissions by about 44%. These figures demonstrate how resale and reuse can reduce the environmental burden associated with new production. Therefore, sustainability impact is a critical indicator for evaluating whether re-commerce growth is translating into tangible reductions in emissions and resource consumption.
- Global textile waste reaches approximately 92 million tonnes annually, while the average duration of garment use declined by 36% between 2000 and 2015. The combination of rising textile disposal and shorter product lifecycles creates a large pool of underutilized garments that can be diverted toward resale, reuse, and re-commerce channels, thereby supporting market growth.
- The global smartphone market is forecast to ship approximately 1.25 billion new smartphones in 2025, while shipments of used smartphones are expected to grow 3.2% year-over-year, more than three times the projected growth rate of the new smartphone market. Faster growth in used-device circulation, supported by trade-in programs and improved refurbishment quality, is expanding the supply of re-commerce inventory across smartphones and other consumer electronics.
- The global trade of used clothing has increased sevenfold over the past four decades, while more than 80% of clothing purchased globally is still disposed of as general waste. This widening gap between product availability and end-of-life disposal highlights significant untapped resale inventory, particularly as regulations and circular-economy initiatives increasingly encourage reuse and longer product lifecycles.
Re-Commerce Market Scope
| Category | Segments |
|---|---|
| By Type | Peer-to-Peer Marketplaces, Resale Marketplaces, Refurbished Goods Marketplaces |
| By Product | Electronics (Smartphones & Tablets, Laptops & Computers, Cameras and Photography Equipment, Home Appliances (Refurbished Refrigerators, Washing Machines, etc.), Others (Networking Equipment, Gaming Consoles and Accessories, etc.)), Fashion & Apparel (Clothing, Footwear, Accessories (Jewelry, Watches, Handbags, etc.)), Furniture and Home Goods (Sofas and Couches, Tables & Chairs, Home Decor (Rugs, Paintings, Vases, etc.), Others (Garden Equipment, Bathroom Accessories, etc.)), Automotive (Used Vehicles, Vehicle Parts and Accessories), Sports and Fitness Equipment, Others (Toys, Collectibles, Books, etc. |
| By Product Category | Non-Luxury, Luxury |
| By Age Group | Up to 18 Years, 19-25 Years, 26-40 Years, 41-55 Years, Above 56 Years |
Re-Commerce Market Growth Drivers
Rising Consumer Demand for Cost-Effective Alternatives Accelerates Re-Commerce Adoption
Rising living costs and expensive new products are encouraging consumers to choose pre-owned, refurbished, and repaired goods, making affordability a key driver of global re-commerce. India’s Telecom Regulatory Authority noted that second-hand smartphones provide a cheaper entry point for first-time smartphone and data users, highlighting the role of resale in expanding access to technology. This trend is reinforced by the rising cost of new devices and growing demand for certified refurbished alternatives.
In 2025, the GSMA reported that the global market for circular mobile devices and services could exceed USD 150 billion by 2027, reflecting increasing consumer acceptance of repair and reuse. Furthermore, the European Union’s 2025 smartphone ecodesign rules are expected to help consumers save approximately USD 22.8 billion by 2030, strengthening demand for longer-lasting and repairable devices. Moreover, the UK’s Defra plans for 80% of end-user devices to be refurbished or remanufactured by 2030.
Consequently, affordability combined with expanding refurbishment infrastructure and government-backed circular-economy initiatives will increase consumer participation in resale markets. As more consumers prioritize value for money, re-commerce platforms and refurbished-product ecosystems are expected to capture a larger share of global consumption.
Recent Trends
AI-Powered Resale Discovery Enhances Personalization and Marketplace Efficiency
AI-powered resale discovery is becoming a key trend in the global re-commerce market by making secondhand shopping easier, more personalized, and efficient. Unlike traditional retail, re-commerce platforms manage highly fragmented inventories where products vary by brand, size, condition, style, and seller. AI helps address this challenge through visual search, personalized recommendations, automated listing creation, product matching, and pricing assistance. For instance, in 2024, ThredUp introduced AI-powered discovery tools that allow shoppers to find products using more personalized searches and recommendations.
The company reported that its enhanced AI search capabilities increased searches per session by 38% after launch. In another example, eBay uses AI to generate product descriptions and item details from seller-provided images, reducing the time required to create listings. Its AI listing technology had been tried by approximately 30% of U.S. sellers using the app on a given day, with more than 95% of users who tried it opting to use the generated descriptions, including after edits. Similarly, in 2025, Poshmark introduced its Smart List AI tool to identify product characteristics from images and generate listing information. These applications demonstrate how AI is transforming re-commerce from fragmented peer-to-peer selling into a more searchable, personalized, and scalable retail ecosystem.
Re-Commerce Market Opportunities and Challenges
Consumer Quality Concerns Challenge Re-Commerce Adoption, Creating Opportunities for Certified Refurbishment and Quality Assurance
Concerns about the condition, durability, performance, and remaining lifespan of used products remain a major challenge for the global re-commerce market. Unlike new goods, pre-owned products can vary widely in quality, while hidden defects, inconsistent refurbishment standards, and limited after-sales support can discourage buyers. This is particularly important for electronics, where battery health and reliability directly influence purchasing decisions. The European Commission’s 2025 smartphone rules address this trust gap by requiring batteries to retain at least 80% of initial capacity after 800 charge cycles, while manufacturers must make critical spare parts available within 5–10 working days for up to seven years after a model’s sales period.
However, this challenge creates a significant opportunity for professionalized re-commerce. Certified refurbishment, standardized grading, warranties, and quality guarantees can convert uncertainty into consumer confidence. For example, Back Market accepts only about one in three seller applicants and provides refurbished-device buyers with a 30-day return period and one-year warranty. Similarly, EU consumer rules allow professional sellers of second-hand goods to provide a legal guarantee of at least one year.
Consequently, investments in testing, authentication, repairability, warranties, and transparent product histories can reduce perceived risk and accelerate re-commerce adoption. As trust improves, more consumers are likely to shift from new products to certified pre-owned and refurbished alternatives, expanding market participation and transaction volumes.
Segmentation Insights
Peer-to-Peer Marketplaces Lead with Approximately 45% Share of Total Demand
Peer-to-Peer (P2P) marketplaces account for approximately 45% of the global re-commerce industry, making them the leading marketplace type. Their dominance is supported by the growing adoption of digital platforms that directly connect individual sellers with buyers, enabling consumers to monetize unused or pre-owned products while offering buyers access to lower-priced alternatives. Platforms such as Vinted, eBay, Depop, and Facebook Marketplace have expanded P2P resale across apparel, footwear, electronics, collectibles, furniture, and other consumer categories.
The model benefits from relatively low entry barriers, broad product variety, flexible pricing, and convenient mobile-based transactions. Increasing consumer interest in affordability and sustainable consumption is further encouraging individuals to purchase and resell used products. In addition, improved digital payments, integrated shipping services, seller ratings, buyer protection, and AI-enabled listing and product-discovery tools are strengthening trust and transaction efficiency. As more consumers view unused products as resale assets rather than waste, P2P marketplaces are expected to remain a core growth engine of the global re-commerce ecosystem. Based on type, the scope has been segmented into
- Peer-to-Peer Marketplaces
- Resale Marketplaces
- Refurbished Goods Marketplaces
Non-Luxury Products Lead with Approximately 80% Share of Total Demand
Non-luxury products represent the largest product category in the global re-commerce industry, accounting for approximately 80% of total demand. The segment benefits from the broad availability and frequent resale of everyday consumer products, including apparel, footwear, electronics, furniture, books, toys, and household goods. Consumers increasingly purchase these products through secondhand platforms because they offer lower prices, wider product selection, and opportunities to access quality brands at affordable rates.
Platforms such as Vinted, eBay, Depop, and Facebook Marketplace have supported the expansion of non-luxury re-commerce by enabling consumers to easily list, discover, purchase, and resell used products. Growing cost-consciousness, particularly among younger consumers, is further encouraging buyers to consider pre-owned products as practical alternatives to new goods. In addition, increasing awareness of circular consumption and product reuse is strengthening demand. The large customer base, high transaction frequency, and availability of products across multiple categories are expected to keep non-luxury goods at the forefront of global re-commerce demand. By product category, the scope has been classified into
- Non-Luxury
- Luxury
Re-Commerce Market Geographical Outlook
North America accounts for approximately 40% of global re-commerce demand, making it the leading regional market due to strong consumer acceptance of pre-owned products, mature digital resale platforms, and established trade-in and refurbishment ecosystems. The United States demonstrates this momentum, with its second-hand apparel market growing 14% in 2024, while online resale increased 23% during the same year.
Furthermore, Apple’s Certified Refurbished program supports consumer confidence by offering fully tested products with a one-year warranty and savings of up to 15% on selected devices. Apple’s Trade-In program also allows consumers to exchange eligible devices for purchase credit or gift cards. Similarly, Best Buy’s trade-in program supports the collection of used electronics, strengthening the supply of devices entering organized reuse and recycling channels.
These developments demonstrate how North America combines high consumer demand with organized resale, trade-in, and refurbishment infrastructure, reinforcing its position as the largest regional re-commerce market.
Re-Commerce Market Competitive Analysis
The global re-commerce market remains highly fragmented, with leading companies such as eBay Inc., Back Market, Vinted Group, ThredUp Inc., and The RealReal, Inc. collectively accounting for an estimated 10% of the global market share.
Key Players in the Re-Commerce Market
- eBay Inc.
- Back Market
- Vinted Group
- ThredUp Inc.
- The RealReal, Inc.
- Vestiaire Collective SAS
- Mercari, Inc.
- CarMax, Inc.
- Poshmark, Inc.
- Whatnot, Inc.
- Swappa, LLC
- Sims Limited
- Re-commerce Group
- OfferUp, Inc.
- Wallapop S.L.
- Others
Re-Commerce Industry News and Recent Developments
-
BAACAL Launches Resale Program Through ThredUp
In February 2026, fashion brand BAACAL launched a Clean Out resale program powered by ThredUp. Customers can send in gently used clothing from any brand and receive BAACAL shopping credit. The initiative expands branded resale into the plus-size fashion segment and demonstrates how re-commerce platforms are enabling smaller and specialized brands to introduce circular resale programs.
Impact Analysis: BAACAL’s resale program strengthens the integration of re-commerce into specialized fashion segments, particularly plus-size apparel, where second-hand availability can be comparatively limited. By accepting clothing from any brand and providing shopping credit, the initiative encourages consumers to return unused garments while generating repeat purchases. The model expands inventory circulation, improves customer engagement, and demonstrates how resale infrastructure can help niche fashion brands adopt circular business models without developing independent resale systems.
-
Re-commerce Group Launches “Forward Trade-in” Solution
In May 2025, Re-commerce Group launched Forward Trade-in, allowing consumers to know the guaranteed future buyback value of electronic devices at the time of purchase. The service covers smartphones, tablets, laptops, and smartwatches, enabling telecom operators, retailers, and businesses to offer predictable resale value and support affordability. The initiative strengthens the connection between new-device purchases and future re-commerce transactions.
Impact Analysis: The Forward Trade-in solution reduces uncertainty around the future value of electronic devices by providing consumers with a guaranteed buyback value at the time of purchase. This can encourage upgrades while ensuring a predictable flow of devices into refurbishment and resale channels. For retailers, telecom operators, and businesses, the model supports customer retention and improves residual-value management, strengthening the connection between primary sales and future re-commerce transactions.
-
: ThredUp Launches Digital Vintage Pop-Up
In May 2025, ThredUp launched its first digital vintage pop-up in partnership with Beyond Retro, featuring more than 20,000 curated vintage and vintage-inspired products. The initiative expanded online access to vintage resale and demonstrated how digital platforms are using curated collections to increase the appeal of second-hand fashion.
Impact Analysis: ThredUp’s digital vintage pop-up strengthens the appeal of second-hand fashion by combining curated inventory with the convenience of online shopping. Featuring more than 20,000 vintage and vintage-inspired products, the initiative improves product discovery and helps attract consumers seeking distinctive styles unavailable through conventional retail. The development can increase digital engagement, broaden participation in vintage resale, and encourage platforms to use curated, theme-based collections to grow re-commerce demand.
Frequently Asked Questions
- Market Segmentation
- Introduction
- Product Definition
- Research Process
- Assumptions
- Executive Summary
- Re-Commerce Market Consumer Behavior Analysis
- Selling Motivation
- Buying Preference/ Motivation
- The Role of Sustainability in Choosing Resale/Refurbished Products
- Re-Commerce Market Startup Ecosystem
- Year of Establishment
- Amount Raised (USD Million)
- Series of Fund Raise
- Purpose of Fund Raise
- Investors Involved
- Re-Commerce Market Policies, Regulations, and Product Standards
- Re-Commerce Market Trends & Developments
- Re-Commerce Market Dynamics
- Growth Factors
- Challenges
- Re-Commerce Market Hotspot & Opportunities
- Re-Commerce Market Outlook, 2022-2032
- Market Size & Outlook
- By Revenues (0055SD Million)
- Market Segmentation & Outlook
- By Type- Market Size & Forecast 2022-2032, USD Million
- Peer-to-Peer Marketplaces
- Resale Marketplaces
- Refurbished Goods Marketplaces
- By Product- Market Size & Forecast 2022-2032, USD Million
- Electronics
- Smartphones & Tablets
- Laptops & Computers
- Cameras and Photography Equipment
- Home Appliances (Refurbished Refrigerators, Washing Machines, etc.)
- Others (Networking Equipment, Gaming Consoles and Accessories, etc.)
- Fashion & Apparel
- Clothing
- Footwear
- Accessories (Jewelry, Watches, Handbags, etc.)
- Furniture and Home Goods
- Sofas and Couches
- Tables & Chairs
- Home Decor (Rugs, Paintings, Vases, etc.)
- Others (Garden Equipment, Bathroom Accessories, etc.)
- Automotive
- Used Vehicles
- Vehicle Parts and Accessories
- Sports and Fitness Equipment
- Others (Toys, Collectibles, Books, etc.)
- Electronics
- By Product Category- Market Size & Forecast 2022-2032, USD Million
- Non-Luxury
- Luxury
- By Age Group- Market Size & Forecast 2022-2032, USD Million
- Up to 18 Years
- 19-25 Years
- 26-40 Years
- 41-55 Years
- Above 56 Years
- By Region
- North America
- South America
- Europe
- Middle East & Africa
- Asia Pacific
- By Company
- Competition Characteristics
- Market Share & Analysis
- By Type- Market Size & Forecast 2022-2032, USD Million
- Market Size & Outlook
- North America Re-Commerce Market Outlook, 2022-2032
- Market Size & Outlook
- By Revenues (USD Million)
- Market Segmentation & Outlook
- By Type- Market Size & Forecast 2022-2032, USD Million
- By Product- Market Size & Forecast 2022-2032, USD Million
- By Product Category- Market Size & Forecast 2022-2032, USD Million
- By Age Group- Market Size & Forecast 2022-2032, USD Million
- By Country
- The US
- Canada
- Mexico
- The US Re-Commerce Market Outlook, 2022-2032
- Market Size & Outlook
- By Revenues (USD Million)
- Market Segmentation & Outlook
- By Type- Market Size & Forecast 2022-2032, USD Million
- By Product- Market Size & Forecast 2022-2032, USD Million
- By Product Category- Market Size & Forecast 2022-2032, USD Million
- By Age Group- Market Size & Forecast 2022-2032, USD Million
- Market Size & Outlook
- Canada Re-Commerce Market Outlook, 2022-2032
- Market Size & Outlook
- By Revenues (USD Million)
- Market Segmentation & Outlook
- By Type- Market Size & Forecast 2022-2032, USD Million
- By Product- Market Size & Forecast 2022-2032, USD Million
- By Product Category- Market Size & Forecast 2022-2032, USD Million
- By Age Group- Market Size & Forecast 2022-2032, USD Million
- Market Size & Outlook
- Mexico Re-Commerce Market Outlook, 2022-2032
- Market Size & Outlook
- By Revenues (USD Million)
- Market Segmentation & Outlook
- By Type- Market Size & Forecast 2022-2032, USD Million
- By Product- Market Size & Forecast 2022-2032, USD Million
- By Product Category- Market Size & Forecast 2022-2032, USD Million
- By Age Group- Market Size & Forecast 2022-2032, USD Million
- Market Size & Outlook
- Market Size & Outlook
- South America Re-Commerce Market Outlook, 2022-2032
- Market Size & Outlook
- By Revenues (USD Million)
- Market Segmentation & Outlook
- By Type- Market Size & Forecast 2022-2032, USD Million
- By Product- Market Size & Forecast 2022-2032, USD Million
- By Product Category- Market Size & Forecast 2022-2032, USD Million
- By Age Group- Market Size & Forecast 2022-2032, USD Million
- By Country
- Brazil
- Argentina
- Chile
- Colombia
- Rest of South America
- Brazil Re-Commerce Market Outlook, 2022-2032
- Market Size & Outlook
- By Revenues (USD Million)
- Market Segmentation & Outlook
- By Type- Market Size & Forecast 2022-2032, USD Million
- By Product- Market Size & Forecast 2022-2032, USD Million
- By Product Category- Market Size & Forecast 2022-2032, USD Million
- By Age Group- Market Size & Forecast 2022-2032, USD Million
- Market Size & Outlook
- Argentina Re-Commerce Market Outlook, 2022-2032
- Market Size & Outlook
- By Revenues (USD Million)
- Market Segmentation & Outlook
- By Type- Market Size & Forecast 2022-2032, USD Million
- By Product- Market Size & Forecast 2022-2032, USD Million
- By Product Category- Market Size & Forecast 2022-2032, USD Million
- By Age Group- Market Size & Forecast 2022-2032, USD Million
- Market Size & Outlook
- Chile Re-Commerce Market Outlook, 2022-2032
- Market Size & Outlook
- By Revenues (USD Million)
- Market Segmentation & Outlook
- By Type- Market Size & Forecast 2022-2032, USD Million
- By Product- Market Size & Forecast 2022-2032, USD Million
- By Product Category- Market Size & Forecast 2022-2032, USD Million
- By Age Group- Market Size & Forecast 2022-2032, USD Million
- Market Size & Outlook
- Colombia Re-Commerce Market Outlook, 2022-2032
- Market Size & Outlook
- By Revenues (USD Million)
- Market Segmentation & Outlook
- By Type- Market Size & Forecast 2022-2032, USD Million
- By Product- Market Size & Forecast 2022-2032, USD Million
- By Product Category- Market Size & Forecast 2022-2032, USD Million
- By Age Group- Market Size & Forecast 2022-2032, USD Million
- Market Size & Outlook
- Market Size & Outlook
- Europe Re-Commerce Market Outlook, 2022-2032
- Market Size & Outlook
- By Revenues (USD Million)
- Market Segmentation & Outlook
- By Type- Market Size & Forecast 2022-2032, USD Million
- By Product- Market Size & Forecast 2022-2032, USD Million
- By Product Category- Market Size & Forecast 2022-2032, USD Million
- By Age Group- Market Size & Forecast 2022-2032, USD Million
- By Country
- The UK
- Germany
- France
- Italy
- Spain
- Netherlands
- Rest of Europe
- The UK Re-Commerce Market Outlook, 2022-2032
- Market Size & Outlook
- By Revenues (USD Million)
- Market Segmentation & Outlook
- By Type- Market Size & Forecast 2022-2032, USD Million
- By Product- Market Size & Forecast 2022-2032, USD Million
- By Product Category- Market Size & Forecast 2022-2032, USD Million
- By Age Group- Market Size & Forecast 2022-2032, USD Million
- Market Size & Outlook
- Germany Re-Commerce Market Outlook, 2022-2032
- Market Size & Outlook
- By Revenues (USD Million)
- Market Segmentation & Outlook
- By Type- Market Size & Forecast 2022-2032, USD Million
- By Product- Market Size & Forecast 2022-2032, USD Million
- By Product Category- Market Size & Forecast 2022-2032, USD Million
- By Age Group- Market Size & Forecast 2022-2032, USD Million
- Market Size & Outlook
- France Re-Commerce Market Outlook, 2022-2032
- Market Size & Outlook
- By Revenues (USD Million)
- Market Segmentation & Outlook
- By Type- Market Size & Forecast 2022-2032, USD Million
- By Product- Market Size & Forecast 2022-2032, USD Million
- By Product Category- Market Size & Forecast 2022-2032, USD Million
- By Age Group- Market Size & Forecast 2022-2032, USD Million
- Market Size & Outlook
- Italy Re-Commerce Market Outlook, 2022-2032
- Market Size & Outlook
- By Revenues (USD Million)
- Market Segmentation & Outlook
- By Type- Market Size & Forecast 2022-2032, USD Million
- By Product- Market Size & Forecast 2022-2032, USD Million
- By Product Category- Market Size & Forecast 2022-2032, USD Million
- By Age Group- Market Size & Forecast 2022-2032, USD Million
- Market Size & Outlook
- Spain Re-Commerce Market Outlook, 2022-2032
- Market Size & Outlook
- By Revenues (USD Million)
- Market Segmentation & Outlook
- By Type- Market Size & Forecast 2022-2032, USD Million
- By Product- Market Size & Forecast 2022-2032, USD Million
- By Product Category- Market Size & Forecast 2022-2032, USD Million
- By Age Group- Market Size & Forecast 2022-2032, USD Million
- Market Size & Outlook
- Netherlands Re-Commerce Market Outlook, 2022-2032
- Market Size & Outlook
- By Revenues (USD Million)
- Market Segmentation & Outlook
- By Type- Market Size & Forecast 2022-2032, USD Million
- By Product- Market Size & Forecast 2022-2032, USD Million
- By Product Category- Market Size & Forecast 2022-2032, USD Million
- By Age Group- Market Size & Forecast 2022-2032, USD Million
- Market Size & Outlook
- Market Size & Outlook
- Middle East & Africa Re-Commerce Market Outlook, 2022-2032
- Market Size & Outlook
- By Revenues (USD Million)
- Market Segmentation & Outlook
- By Type- Market Size & Forecast 2022-2032, USD Million
- By Product- Market Size & Forecast 2022-2032, USD Million
- By Product Category- Market Size & Forecast 2022-2032, USD Million
- By Age Group- Market Size & Forecast 2022-2032, USD Million
- By Country
- Saudi Arabia
- The UAE
- South Africa
- Egypt
- Qatar
- Kuwait
- Rest of Middle East & Africa
- Saudi Arabia Re-Commerce Market Outlook, 2022-2032
- Market Size & Outlook
- By Revenues (USD Million)
- Market Segmentation & Outlook
- By Type- Market Size & Forecast 2022-2032, USD Million
- By Product- Market Size & Forecast 2022-2032, USD Million
- By Product Category- Market Size & Forecast 2022-2032, USD Million
- By Age Group- Market Size & Forecast 2022-2032, USD Million
- Market Size & Outlook
- The UAE Re-Commerce Market Outlook, 2022-2032
- Market Size & Outlook
- By Revenues (USD Million)
- Market Segmentation & Outlook
- By Type- Market Size & Forecast 2022-2032, USD Million
- By Product- Market Size & Forecast 2022-2032, USD Million
- By Product Category- Market Size & Forecast 2022-2032, USD Million
- By Age Group- Market Size & Forecast 2022-2032, USD Million
- Market Size & Outlook
- South Africa Re-Commerce Market Outlook, 2022-2032
- Market Size & Outlook
- By Revenues (USD Million)
- Market Segmentation & Outlook
- By Type- Market Size & Forecast 2022-2032, USD Million
- By Product- Market Size & Forecast 2022-2032, USD Million
- By Product Category- Market Size & Forecast 2022-2032, USD Million
- By Age Group- Market Size & Forecast 2022-2032, USD Million
- Market Size & Outlook
- Egypt Re-Commerce Market Outlook, 2022-2032
- Market Size & Outlook
- By Revenues (USD Million)
- Market Segmentation & Outlook
- By Type- Market Size & Forecast 2022-2032, USD Million
- By Product- Market Size & Forecast 2022-2032, USD Million
- By Product Category- Market Size & Forecast 2022-2032, USD Million
- By Age Group- Market Size & Forecast 2022-2032, USD Million
- Market Size & Outlook
- Qatar Re-Commerce Market Outlook, 2022-2032
- Market Size & Outlook
- By Revenues (USD Million)
- Market Segmentation & Outlook
- By Type- Market Size & Forecast 2022-2032, USD Million
- By Product- Market Size & Forecast 2022-2032, USD Million
- By Product Category- Market Size & Forecast 2022-2032, USD Million
- By Age Group- Market Size & Forecast 2022-2032, USD Million
- Market Size & Outlook
- Kuwait Re-Commerce Market Outlook, 2022-2032
- Market Size & Outlook
- By Revenues (USD Million)
- Market Segmentation & Outlook
- By Type- Market Size & Forecast 2022-2032, USD Million
- By Product- Market Size & Forecast 2022-2032, USD Million
- By Product Category- Market Size & Forecast 2022-2032, USD Million
- By Age Group- Market Size & Forecast 2022-2032, USD Million
- Market Size & Outlook
- Market Size & Outlook
- Asia Pacific Re-Commerce Market Outlook, 2022-2032
- Market Size & Outlook
- By Revenues (USD Million)
- Market Segmentation & Outlook
- By Type- Market Size & Forecast 2022-2032, USD Million
- By Product- Market Size & Forecast 2022-2032, USD Million
- By Product Category- Market Size & Forecast 2022-2032, USD Million
- By Age Group- Market Size & Forecast 2022-2032, USD Million
- By Country
- China
- Japan
- India
- South Korea
- Australia
- Indonesia
- Thailand
- Malaysia
- Singapore
- Rest of Asia-Pacific
- China Re-Commerce Market Outlook, 2022-2032
- Market Size & Outlook
- By Revenues (USD Million)
- Market Segmentation & Outlook
- By Type- Market Size & Forecast 2022-2032, USD Million
- By Product- Market Size & Forecast 2022-2032, USD Million
- By Product Category- Market Size & Forecast 2022-2032, USD Million
- By Age Group- Market Size & Forecast 2022-2032, USD Million
- Market Size & Outlook
- Japan Re-Commerce Market Outlook, 2022-2032
- Market Size & Outlook
- By Revenues (USD Million)
- Market Segmentation & Outlook
- By Type- Market Size & Forecast 2022-2032, USD Million
- By Product- Market Size & Forecast 2022-2032, USD Million
- By Product Category- Market Size & Forecast 2022-2032, USD Million
- By Age Group- Market Size & Forecast 2022-2032, USD Million
- Market Size & Outlook
- India Re-Commerce Market Outlook, 2022-2032
- Market Size & Outlook
- By Revenues (USD Million)
- Market Segmentation & Outlook
- By Type- Market Size & Forecast 2022-2032, USD Million
- By Product- Market Size & Forecast 2022-2032, USD Million
- By Product Category- Market Size & Forecast 2022-2032, USD Million
- By Age Group- Market Size & Forecast 2022-2032, USD Million
- Market Size & Outlook
- South Korea Re-Commerce Market Outlook, 2022-2032
- Market Size & Outlook
- By Revenues (USD Million)
- Market Segmentation & Outlook
- By Type- Market Size & Forecast 2022-2032, USD Million
- By Product- Market Size & Forecast 2022-2032, USD Million
- By Product Category- Market Size & Forecast 2022-2032, USD Million
- By Age Group- Market Size & Forecast 2022-2032, USD Million
- Market Size & Outlook
- Australia Re-Commerce Market Outlook, 2022-2032
- Market Size & Outlook
- By Revenues (USD Million)
- Market Segmentation & Outlook
- By Type- Market Size & Forecast 2022-2032, USD Million
- By Product- Market Size & Forecast 2022-2032, USD Million
- By Product Category- Market Size & Forecast 2022-2032, USD Million
- By Age Group- Market Size & Forecast 2022-2032, USD Million
- Market Size & Outlook
- Indonesia Re-Commerce Market Outlook, 2022-2032
- Market Size & Outlook
- By Revenues (USD Million)
- Market Segmentation & Outlook
- By Type- Market Size & Forecast 2022-2032, USD Million
- By Product- Market Size & Forecast 2022-2032, USD Million
- By Product Category- Market Size & Forecast 2022-2032, USD Million
- By Age Group- Market Size & Forecast 2022-2032, USD Million
- Market Size & Outlook
- Thailand Re-Commerce Market Outlook, 2022-2032
- Market Size & Outlook
- By Revenues (USD Million)
- Market Segmentation & Outlook
- By Type- Market Size & Forecast 2022-2032, USD Million
- By Product- Market Size & Forecast 2022-2032, USD Million
- By Product Category- Market Size & Forecast 2022-2032, USD Million
- By Age Group- Market Size & Forecast 2022-2032, USD Million
- Market Size & Outlook
- Malaysia Re-Commerce Market Outlook, 2022-2032
- Market Size & Outlook
- By Revenues (USD Million)
- Market Segmentation & Outlook
- By Type- Market Size & Forecast 2022-2032, USD Million
- By Product- Market Size & Forecast 2022-2032, USD Million
- By Product Category- Market Size & Forecast 2022-2032, USD Million
- By Age Group- Market Size & Forecast 2022-2032, USD Million
- Market Size & Outlook
- Singapore Re-Commerce Market Outlook, 2022-2032
- Market Size & Outlook
- By Revenues (USD Million)
- Market Segmentation & Outlook
- By Type- Market Size & Forecast 2022-2032, USD Million
- By Product- Market Size & Forecast 2022-2032, USD Million
- By Product Category- Market Size & Forecast 2022-2032, USD Million
- By Age Group- Market Size & Forecast 2022-2032, USD Million
- Market Size & Outlook
- Market Size & Outlook
- Re-Commerce Market Key Strategic Imperatives for Success & Growth
- Competitive Outlook
- Company Profiles
- eBay Inc.
- Business Description
- Product Portfolio
- Collaborations & Alliances
- Recent Developments
- Financial Details
- Others
- Back Market
- Business Description
- Product Portfolio
- Collaborations & Alliances
- Recent Developments
- Financial Details
- Others
- Vinted Group
- Business Description
- Product Portfolio
- Collaborations & Alliances
- Recent Developments
- Financial Details
- Others
- ThredUp Inc.
- Business Description
- Product Portfolio
- Collaborations & Alliances
- Recent Developments
- Financial Details
- Others
- The RealReal, Inc.
- Business Description
- Product Portfolio
- Collaborations & Alliances
- Recent Developments
- Financial Details
- Others
- Vestiaire Collective SAS
- Business Description
- Product Portfolio
- Collaborations & Alliances
- Recent Developments
- Financial Details
- Others
- Mercari, Inc.
- Business Description
- Product Portfolio
- Collaborations & Alliances
- Recent Developments
- Financial Details
- Others
- CarMax, Inc.
- Business Description
- Product Portfolio
- Collaborations & Alliances
- Recent Developments
- Financial Details
- Others
- Poshmark, Inc.
- Business Description
- Product Portfolio
- Collaborations & Alliances
- Recent Developments
- Financial Details
- Others
- Whatnot, Inc.
- Business Description
- Product Portfolio
- Collaborations & Alliances
- Recent Developments
- Financial Details
- Others
- Swappa, LLC
- Business Description
- Product Portfolio
- Collaborations & Alliances
- Recent Developments
- Financial Details
- Others
- Sims Limited
- Business Description
- Product Portfolio
- Collaborations & Alliances
- Recent Developments
- Financial Details
- Others
- Recommerce Group
- Business Description
- Product Portfolio
- Collaborations & Alliances
- Recent Developments
- Financial Details
- Others
- OfferUp, Inc.
- Business Description
- Product Portfolio
- Collaborations & Alliances
- Recent Developments
- Financial Details
- Others
- Wallapop S.L.
- Business Description
- Product Portfolio
- Collaborations & Alliances
- Recent Developments
- Financial Details
- Others
- eBay Inc.
- Company Profiles
- Disclaimer
MarkNtel Advisors follows a robust and iterative research methodology designed to ensure maximum accuracy and minimize deviation in market estimates and forecasts. Our approach combines both bottom-up and top-down techniques to effectively segment and quantify various aspects of the market. A consistent feature across all our research reports is data triangulation, which examines the market from three distinct perspectives to validate findings. Key components of our research process include:
1. Scope & Research Design At the outset, MarkNtel Advisors define the research objectives and formulate pertinent questions. This phase involves determining the type of research—qualitative or quantitative—and designing a methodology that outlines data collection methods, target demographics, and analytical tools. They also establish timelines and budgets to ensure the research aligns with client goals.
2. Sample Selection and Data Collection In this stage, the firm identifies the target audience and determines the appropriate sample size to ensure representativeness. They employ various sampling methods, such as random or stratified sampling, based on the research objectives. Data collection is carried out using tools like surveys, interviews, and observations, ensuring the gathered data is reliable and relevant.
3. Data Analysis and Validation Once data is collected, MarkNtel Advisors undertake a rigorous analysis process. This includes cleaning the data to remove inconsistencies, employing statistical software for quantitative analysis, and thematic analysis for qualitative data. Validation steps are taken to ensure the accuracy and reliability of the findings, minimizing biases and errors.

4. Data Forecast and FinalizationThe final phase involves forecasting future market trends based on the analyzed data. MarkNtel Advisors utilize predictive modeling and time series analysis to anticipate market behaviors. The insights are then compiled into comprehensive reports, featuring visual aids like charts and graphs, and include strategic recommendations to inform client decision-making
We offer flexible licensing options to cater to varying organizational needs. Choose the pricing pack that best suits your requirements:
Buy Now Inquire Before Buying
 Request Customization
 Talk to our Consultant